

Chewy, Inc. CHWY
20.37 USD -0.33 (-1.59%)
Regular-session close
20.40 +0.03 +0.15%
After hours · Nov 19, 7:50 PM ET
20.13 Day range 20.67
17.40 52-week range 37.34
- YTD
- -38.37%
- 1 year
- -40.47%
5D -2.21 (-9.79%)
- Market cap
- 8.19B
- Revenue (ttm)
- 13.07B
- Profit margin
- 2.09%
- EPS (ttm)
- 0.65
- Shares out
- 225.45M
- P/E ratio
- 31.34
- Forward P/E
- 10.91
- YTD return
- -38.37%
- 1-year return
- -40.47%
- 50-day average
- 20.63
- Volume
- 5.37M
- Avg volume
- 8.29M
- Open
- 20.61
- Previous close
- 20.70
- Day's range
- 20.13 – 20.67
- 52-week range
- 17.40 – 37.34
- Beta
- 1.32
- Analysts
- Buy
- Price target
- 28.35 (+39.2%)
- Earnings date
- Dec 9, 2026
Key statistics
- 200-day average
- 22.70
- Enterprise value
- 8.87B
- PEG ratio
- 0.37
- Price / sales
- 0.63
- Price / book
- 22.06
- Revenue growth
- 7.30%
- Free cash flow
- 449.08M
- Total cash
- 612.20M
- Total debt
- 1.16B
- Return on equity
- 71.99%
- Short % of float
- 11.13%
Fundamental scorecard
16 of 25 checks passed on CHWY’s reported financials
16of 25 checks passed
- Value 4 of 5
- Growth 5 of 5
- Profitability 4 of 5
- Financial health 3 of 5
- Dividend 0 of 5
Statements to Aug 2, 2026.
Analyst view
Consensus: buy
Buy
Price target (mean) 28.35 +39.2% upside
Now 20.37
- Target (low)
- 21.00
- Target (mean)
- 28.35
- Target (high)
- 36.00
Ratings (0m) 27 18 buy · 9 hold · 0 sell
- Strong buy7
- Buy11
- Hold9
- Sell0
- Strong sell0
Next earnings
Dec 9, 2026
Expected Dec 9, 2026. Consensus EPS estimate 0.3828.
Financials — quick view
CHWY Revenue — quarterly 3.33B
CHWY Net income — quarterly 80.50M
CHWY EPS — quarterly 0.20
Earnings
| Report date | Quarter ending | EPS estimate | EPS reported | Surprise | Surprise % |
|---|---|---|---|---|---|
| Dec 9, 2026 | Nov 2, 2026 | 0.1878 | — | — | — |
| Sep 9, 2026 | Aug 2, 2026 | 0.178 | 0.20 | +0.02 | +12.36% |
| Jun 10, 2026 | May 3, 2026 | 0.2424 | 0.43 | +0.19 | +77.39% |
| Mar 25, 2026 | Feb 1, 2026 | 0.09232 | 0.09 | 0.00 | -2.51% |
| Dec 10, 2025 | Nov 2, 2025 | 0.1248 | 0.14 | +0.02 | +12.18% |
| Sep 10, 2025 | Aug 3, 2025 | 0.1427 | 0.15 | +0.01 | +5.12% |
Upgrades / downgrades
| Date | Firm | Action | From | To |
|---|---|---|---|---|
| Nov 17, 2026 | Stifel | init | — | Hold |
| Sep 29, 2026 | Mizuho | main | Outperform | Outperform |
| Sep 11, 2026 | Goldman Sachs | main | Buy | Buy |
| Sep 11, 2026 | JP Morgan | down | Overweight | Neutral |
| Sep 10, 2026 | Morgan Stanley | main | Overweight | Overweight |
| Sep 10, 2026 | RBC Capital | main | Outperform | Outperform |
About Chewy, Inc.
Chewy, Inc., together with its subsidiaries, engages in the e-commerce business in the United States. It offers pet food and treats, pet supplies and pet medications, and other pet-health products, as well as pet services. The company serves its customer through its retail websites and mobile applications, including Autoship subscription program. Chewy, Inc. was founded in 2010 and is based in Plantation, Florida.
- Sector
- Consumer Cyclical
- Industry
- Internet Retail
- Country
- United States
- Website
- chewy.com
News
 Roaring Kitty Returns: GameStop Tops List of Stocks Primed to Pop
 Here is What to Know Beyond Why Chewy (CHWY) is a Trending Stock
 Chewy Announces Fiscal Third Quarter Financial Results Conference Call
 Chewy (CHWY) Declines More Than Market: Some Information for Investors
 Stifel Initiates Coverage On Chewy with Hold Rating, Announces Price Target of $22
 Lithia Motors (NYSE:LAD) vs. Chewy (NYSE:CHWY) Financial Contrast
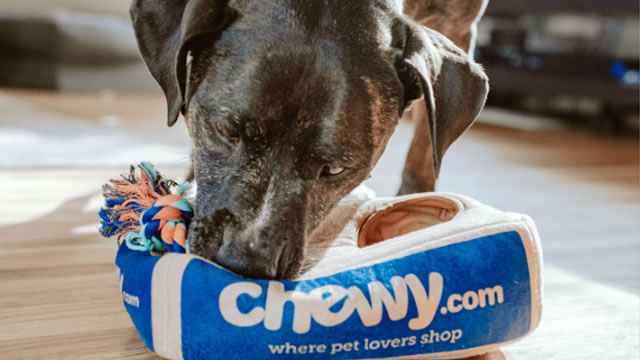 Chewy wants an AI agent to buy your dog food
 Chewy vs. Shopify: Which Consumer Stock Is a Better Buy for 2027?
 Is Chewy Stock a Buy Right Now in November 2026?
 Chewy vs. Etsy: Which Consumer Stock Is a Better Buy for 2027?
Your note
Sign in to keep a note on CHWY — it syncs with the Stock Master app.
Insider holders
| Insider | Relation | Latest transaction | Date | Shares held |
|---|---|---|---|---|
| BILLINGS WILLIAM G. | Officer | Sale | Nov 3, 2026 | 136,578 |
| DEPPE CHRISTOPHER S. | Chief Financial Officer | Stock Award(Grant) | Apr 7, 2026 | 398,329 |
| DICKSON KRISTINE | Director | Stock Award(Grant) | Jul 8, 2026 | 35,368 |
| HU DA-WAI | General Counsel | Sale | Jun 28, 2026 | 220,822 |
| MEHTA SATISH | Chief Technology Officer | Sale | Feb 1, 2026 | 575,046 |
| NELSON JAMES LARRY | Director | Stock Award(Grant) | Jul 8, 2026 | 35,351 |
Institution ownership
| Holder | % held | Shares | Value | Reported |
|---|---|---|---|---|
| Bc Partners Pe LP | 78.28% | 176,478,228 | 3.59B | Sep 29, 2026 |
| Blackrock Inc. | 9.99% | 22,512,226 | 458.35M | Sep 29, 2026 |
| Morgan Stanley | 7.71% | 17,371,539 | 353.68M | Sep 29, 2026 |
| AQR Capital Management, LLC | 5.80% | 13,073,360 | 266.17M | Sep 29, 2026 |
| Vanguard Capital Management LLC | 4.35% | 9,804,600 | 199.62M | Sep 29, 2026 |
| Vanguard Portfolio Management LLC | 4.20% | 9,468,258 | 192.77M | Sep 29, 2026 |
Fund ownership
| Holder | % held | Shares | Value | Reported |
|---|---|---|---|---|
| iShares Trust-iShares Core S&P Mid-Cap ETF | 3.68% | 8,302,711 | 169.04M | Sep 29, 2026 |
| VANGUARD INDEX FUNDS-Vanguard Total Stock Market Index Fund | 3.11% | 7,013,755 | 142.80M | Jun 29, 2026 |
| VANGUARD INDEX FUNDS-Vanguard Small-Cap Index Fund | 2.25% | 5,069,719 | 103.22M | Jun 29, 2026 |
| Variable Insurance Products Fund III-VIP Mid Cap Portfolio | 1.56% | 3,510,300 | 71.47M | Sep 29, 2026 |
| VANGUARD INDEX FUNDS-Vanguard Small-Cap Growth Index Fund | 1.29% | 2,918,187 | 59.41M | Jun 29, 2026 |
| Federated Hermes Equity Funds-Federated Hermes MDT Mid Cap Growth Fund | 1.22% | 2,758,972 | 56.17M | Jul 30, 2026 |