

Brixmor Property Group Inc. BRX
Regular-session close
After hours · Nov 20, 6:00 PM ET
- YTD
- +15.64%
- 1 year
- +16.71%
5D +0.08 (+0.26%)
- Market cap
- 9.30B
- Revenue (ttm)
- 1.42B
- Profit margin
- 29.96%
- EPS (ttm)
- 1.38
- Shares out
- 306.87M
- P/E ratio
- 21.97
- Forward P/E
- 26.79
- Dividend
- 1.32 (4.35%)
- Ex-dividend date
- Jan 5, 2027
- YTD return
- +15.64%
- 1-year return
- +16.71%
- Volume
- 4.11M
- Avg volume
- 3.14M
- Open
- 30.50
- Previous close
- 30.33
- Day's range
- 30.31 – 30.86
- 52-week range
- 24.67 – 32.69
- Beta
- 0.94
- Analysts
- Strong Buy
- Price target
- 33.37 (+10.0%)
- Earnings date
- Feb 8, 2027
- 50-day average
- 28.50
Key statistics
- 200-day average
- 29.82
- Enterprise value
- 14.55B
- Price / sales
- 6.55
- Price / book
- 3.08
- Payout ratio
- 89.13%
- Revenue growth
- 5.50%
- Free cash flow
- 648.19M
- Total cash
- 164.43M
- Total debt
- 5.38B
- Return on equity
- 14.19%
- Short % of float
- 11.44%
Fundamental scorecard
11 of 25 checks passed on BRX’s reported financials
11of 25 checks passed
- Value 1 of 5
- Growth 4 of 5
- Profitability 3 of 5
- Financial health 0 of 5
- Dividend 3 of 5
Statements to Sep 30, 2026.
Analyst view
Consensus: strong buy
- Target (low)
- 30.00
- Target (mean)
- 33.37
- Target (high)
- 38.00
- Strong buy3
- Buy10
- Hold2
- Sell0
- Strong sell0
Next earnings
Feb 8, 2027
Expected Feb 8, 2027. Consensus EPS estimate 0.23758.
Financials — quick view
Earnings
| Report date | Quarter ending | EPS estimate | EPS reported | Surprise | Surprise % |
|---|---|---|---|---|---|
| Feb 8, 2027 | Dec 30, 2026 | 0.251 | — | — | — |
| Oct 26, 2026 | Sep 30, 2026 | 0.2263 | 0.28 | +0.05 | +23.73% |
| Jul 27, 2026 | Jun 30, 2026 | 0.2449 | 0.24 | 0.00 | -2.00% |
| Apr 27, 2026 | Mar 31, 2026 | 0.2478 | 0.41 | +0.16 | +65.46% |
| Feb 9, 2026 | Dec 31, 2025 | 0.2389 | 0.44 | +0.20 | +84.18% |
| Oct 27, 2025 | Sep 30, 2025 | 0.2276 | 0.31 | +0.08 | +36.20% |
Upgrades / downgrades
| Date | Firm | Action | From | To |
|---|---|---|---|---|
| Nov 11, 2026 | UBS | main | Buy | Buy |
| Nov 2, 2026 | Citigroup | main | Neutral | Neutral |
| Oct 27, 2026 | Stifel | main | Hold | Hold |
| Oct 12, 2026 | Piper Sandler | main | Overweight | Overweight |
| Oct 9, 2026 | UBS | main | Buy | Buy |
| Sep 24, 2026 | Mizuho | main | Outperform | Outperform |
About Brixmor Property Group Inc.
Brixmor Property Group Inc. owns and operates a high-quality, national portfolio of open-air shopping centers. The Company's 345 retail centers comprise approximately 62 million square feet of prime retail space in established trade areas. Brixmor's properties reflect their vision (to be the center of the communities we serve) and are home to a diverse mix of thriving national, regional and local retailers. Brixmor is a valued partner to a broad range of retailers, including The TJX Companies, The Kroger Co., Publix Super Markets and Ross Stores. Brixmor Property Group Inc. was established on May 27, 2011 and is based in New York, United States.
- Sector
- Real Estate
- Industry
- REIT - Retail
- Country
- United States
- Website
- brixmor.com
News
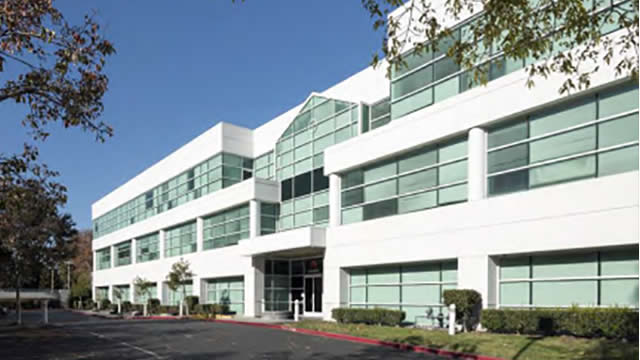 Strip Centers Anchored by the Weekly Grocery Run: $90,000 Across These 3 Owners Pays $3,862 a Year
 UBS Maintains Buy on Brixmor Property Group, Raises Price Target to $35
 What Makes Brixmor Property (BRX) a Strong Momentum Stock: Buy Now?
 Brixmor: 3 Key Takeaways for Long-Term Investors
 BRIXMOR PROPERTY GROUP CLOSES $400 MILLION UNSECURED TERM LOAN
 Citigroup Maintains Neutral on Brixmor Property Group, Lowers Price Target to $32
 Dividend Champion, Contender, And Challenger Highlights: Week November 1
 Brixmor Just Raised Its Dividend 7.3%. These 4 Retail REITs Offer Income Potential
 Brixmor Property Group Inc. (BRX) Q3 2026 Earnings Call Transcript
 What Brixmor Property Group (BRX) Said on Its Q3 Earnings Call
Your note
Sign in to keep a note on BRX — it syncs with the Stock Master app.
Insider holders
| Insider | Relation | Latest transaction | Date | Shares held |
|---|---|---|---|---|
| BERMAN MICHAEL BRUCE | Director | Sale | Aug 11, 2026 | 30,702 |
| CROSLAND SHERYL MAXWELL | Director | Stock Award(Grant) | Apr 21, 2026 | 62,972 |
| DICKSON THOMAS WILLIAM | Director | Stock Award(Grant) | Apr 21, 2026 | 59,702 |
| FINNEGAN BRIAN T | Chief Executive Officer | Stock Award(Grant) | Feb 3, 2026 | 301,110 |
| GALLAGHER STEVEN T | Chief Financial Officer | Stock Award(Grant) | Feb 3, 2026 | 65,512 |
| HORGAN MARK | Chief Investment Officer | Stock Award(Grant) | Feb 3, 2026 | 401,834 |
Institution ownership
| Holder | % held | Shares | Value | Reported |
|---|---|---|---|---|
| Blackrock Inc. | 13.87% | 42,569,339 | 1.29B | Sep 29, 2026 |
| Vanguard Portfolio Management LLC | 9.34% | 28,658,819 | 869.65M | Sep 29, 2026 |
| State Street Corporation | 4.98% | 15,285,308 | 463.83M | Sep 29, 2026 |
| Vanguard Capital Management LLC | 4.50% | 13,803,220 | 418.86M | Sep 29, 2026 |
| CenterSquare Investment Management LLC | 4.43% | 13,589,802 | 412.38M | Sep 29, 2026 |
| Franklin Templeton, Inc. | 2.58% | 7,913,256 | 240.13M | Sep 29, 2026 |
Fund ownership
| Holder | % held | Shares | Value | Reported |
|---|---|---|---|---|
| VANGUARD SPECIALIZED FUNDS-Vanguard Real Estate Index Fund | 3.61% | 11,088,711 | 336.49M | Jul 30, 2026 |
| iShares Trust-iShares Core S&P Mid-Cap ETF | 3.56% | 10,930,871 | 331.70M | Sep 29, 2026 |
| VANGUARD INDEX FUNDS-Vanguard Total Stock Market Index Fund | 3.18% | 9,744,094 | 295.68M | Jun 29, 2026 |
| VANGUARD INDEX FUNDS-Vanguard Small-Cap Index Fund | 2.29% | 7,033,530 | 213.43M | Jun 29, 2026 |
| MFS SERIES TRUST XI-MFS Mid Cap Value Fund | 1.52% | 4,654,367 | 141.24M | Jun 29, 2026 |
| VANGUARD INDEX FUNDS-Vanguard Small-Cap Value Index Fund | 1.45% | 4,457,649 | 135.27M | Jun 29, 2026 |