

APA Corporation APA
47.77 USD -1.05 (-2.15%)
At closeNov 3, 2026, 4:33 PM EST
47.77 0.00 0.00%
After hours · Nov 3, 4:33 PM ET
47.26 Day range 48.78
21.63 52-week range 52.96
- YTD
- +95.30%
- 1 year
- +112.41%
- Market cap
- 16.74B
- Revenue (ttm)
- 8.57B
- Profit margin
- 19.56%
- EPS (ttm)
- 4.73
- Shares out
- 350.35M
- P/E ratio
- 10.10
- Forward P/E
- 8.89
- Dividend
- 1.00 (2.05%)
- Ex-dividend date
- Oct 21, 2026
- YTD return
- +95.30%
- 1-year return
- +112.41%
- Volume
- 6.06M
- Avg volume
- 5.59M
- Open
- 48.17
- Previous close
- 48.82
- Day's range
- 47.26 – 48.78
- 52-week range
- 21.63 – 52.96
- Beta
- 0.28
- Analysts
- Hold
- Price target
- 49.00 (+2.6%)
- Earnings date
- Nov 4, 2026
30m -3.55 (-6.92%)
Key statistics
- Enterprise value
- 21.46B
- PEG ratio
- 1.20
- Price / sales
- 1.95
- Price / book
- 2.39
- Dividend yield
- 2.05%
- Payout ratio
- 21.14%
- Revenue growth
- 9.20%
- Free cash flow
- 2.15B
- Total cash
- 444.00M
- Total debt
- 3.88B
- Return on equity
- 26.66%
- Short % of float
- 8.78%
- 50-day average
- 45.66
- 200-day average
- 37.84
Analyst view
Consensus: hold
Hold
Price target (mean) 49.00 +2.6% upside
Now 47.77
- Target (low)
- 37.00
- Target (mean)
- 49.00
- Target (high)
- 63.00
Ratings (0m) 28 10 buy · 15 hold · 3 sell
- Strong buy2
- Buy8
- Hold15
- Sell3
- Strong sell0
Next earnings
Nov 4, 2026
Expected Nov 4, 2026. Consensus EPS estimate 1.59.
Financials — quick view
APA Revenue — quarterly 2.40B
APA Net income — quarterly 747.00M
APA EPS — quarterly 2.11
Earnings
| Report date | Quarter ending | EPS estimate | EPS reported | Surprise | Surprise % |
|---|---|---|---|---|---|
| Nov 4, 2026 | Sep 30, 2026 | 1.60 | — | — | — |
| Aug 5, 2026 | Jun 30, 2026 | 1.90 | 1.89 | -0.01 | -0.53% |
| May 6, 2026 | Mar 31, 2026 | 1.11 | 1.38 | +0.27 | +24.32% |
| Feb 25, 2026 | Dec 31, 2025 | 0.644 | 0.91 | +0.27 | +41.30% |
| Nov 5, 2025 | Sep 30, 2025 | 0.793 | 0.93 | +0.14 | +17.28% |
| Aug 6, 2025 | Jun 30, 2025 | 0.45 | 0.87 | +0.42 | +93.33% |
Upgrades / downgrades
| Date | Firm | Action | From | To |
|---|---|---|---|---|
| Oct 20, 2026 | Susquehanna | main | Positive | Positive |
| Oct 15, 2026 | Scotiabank | init | — | Sector Perform |
| Oct 15, 2026 | Mizuho | main | Underperform | Underperform |
| Oct 15, 2026 | Morgan Stanley | main | Underweight | Underweight |
| Oct 15, 2026 | RBC Capital | main | Sector Perform | Sector Perform |
| Oct 14, 2026 | Wells Fargo | main | Equal-Weight | Equal-Weight |
About APA Corporation
APA Corporation, an independent energy company, explores for, develops, and produces natural gas, crude oil, and natural gas liquids. The company has oil and gas operations in the United States, Egypt, and North Sea. It also has exploration and appraisal activities in Suriname, as well as holds interests in projects located in Uruguay and internationally. APA Corporation was incorporated in 1954 and is headquartered in Houston, Texas.
- Sector
- Energy
- Industry
- Oil & Gas E&P
- Country
- United States
- Website
- apacorp.com
News
 4 GARP Stocks to Buy Now as Volatility Fuels Value vs. Growth Debate
 What Analyst Projections for Key Metrics Reveal About APA (APA) Q3 Earnings
 Aware Super Pty Ltd as trustee of Aware Super Acquires 24,700 Shares of APA Corporation $APA
 APA Corporation (APA) Hits Fresh High: Is There Still Room to Run?
 APA or LNG: Which Is the Better Value Stock Right Now?
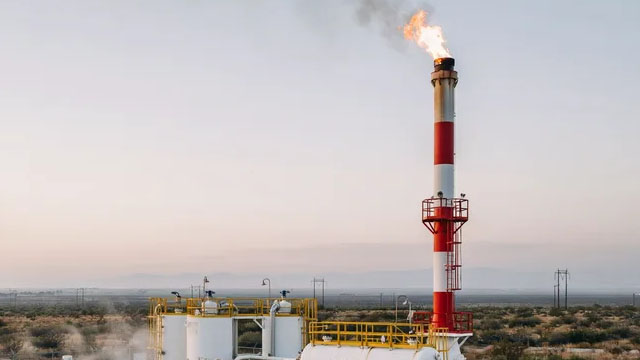 APA (APA) is a Top-Ranked Momentum Stock: Should You Buy?
 APA Gears Up to Report Q3 Earnings: Here's How It Will Fare
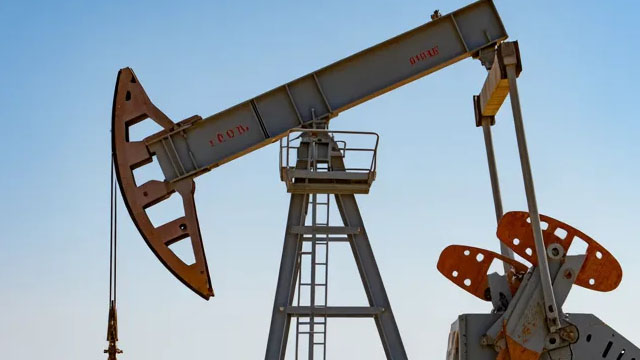 APA (APA) Earnings Expected to Grow: What to Know Ahead of Next Week's Release
 Here's Why APA (APA) is a Strong Growth Stock
 Is Innovex International, Inc. (INVX) Stock Outpacing Its Oils-Energy Peers This Year?
Your note
Sign in to keep a note on APA — it syncs with the Stock Master app.
Insider holders
| Insider | Relation | Latest transaction | Date | Shares held |
|---|---|---|---|---|
| BAY ANNELL R | Director | Stock Award(Grant) | Sep 29, 2026 | 105,525 |
| BRETCHES D. CLAY | Officer | Conversion of Exercise of derivative security | Feb 4, 2025 | 63,839 |
| CHRISTMANN JOHN J IV | Chief Executive Officer | Conversion of Exercise of derivative security | Jan 29, 2026 | 857,915 |
| ELLIS JULIET S. | Director | Stock Award(Grant) | Sep 29, 2026 | 90,969 |
| HOYT REBECCA A | Officer | Conversion of Exercise of derivative security | Feb 4, 2025 | 116,859 |
| JOUNG CHANSOO | Director | Stock Award(Grant) | Sep 29, 2026 | 246,547 |
Institution ownership
| Holder | % held | Shares | Value | Reported |
|---|---|---|---|---|
| Blackrock Inc. | 10.28% | 36,021,838 | 1.72B | Jun 29, 2026 |
| Hotchkis & Wiley Capital Management, LLC | 9.05% | 31,695,303 | 1.51B | Jun 29, 2026 |
| State Street Corporation | 7.19% | 25,181,423 | 1.20B | Jun 29, 2026 |
| Vanguard Capital Management LLC | 6.59% | 23,098,547 | 1.10B | Jun 29, 2026 |
| Vanguard Portfolio Management LLC | 4.95% | 17,331,282 | 827.92M | Jun 29, 2026 |
| Dimensional Fund Advisors LP | 4.81% | 16,838,388 | 804.37M | Jun 29, 2026 |
Fund ownership
| Holder | % held | Shares | Value | Reported |
|---|---|---|---|---|
| VANGUARD WINDSOR FUNDS-Vanguard Windsor II Fund | 5.25% | 18,385,257 | 878.26M | Jul 30, 2026 |
| VANGUARD INDEX FUNDS-Vanguard Total Stock Market Index Fund | 3.21% | 11,229,436 | 536.43M | Jun 29, 2026 |
| SCHWAB STRATEGIC TRUST-Schwab US Dividend Equity ETF | 2.76% | 9,666,512 | 461.77M | Aug 30, 2026 |
| VANGUARD INDEX FUNDS-Vanguard 500 Index Fund | 2.61% | 9,160,639 | 437.60M | Jun 29, 2026 |
| VANGUARD INDEX FUNDS-Vanguard Small-Cap Index Fund | 2.31% | 8,103,131 | 387.09M | Jun 29, 2026 |
| SELECT SECTOR SPDR TRUST-State Street Energy Select Sector SPDR ETF | 2.08% | 7,293,603 | 348.42M | Sep 29, 2026 |