

Realty Income Corporation O
Regular-session close
After hours · Nov 20, 7:56 PM ET
- YTD
- +2.94%
- 1 year
- +3.07%
5D -1.37 (-2.31%)
- Market cap
- 55.34B
- Revenue (ttm)
- 6.22B
- Profit margin
- 21.81%
- EPS (ttm)
- 1.46
- Shares out
- 951.00M
- P/E ratio
- 39.75
- Forward P/E
- 37.37
- Dividend
- 3.29 (5.70%)
- Ex-dividend date
- Nov 30, 2026
- YTD return
- +2.94%
- 1-year return
- +3.07%
- Volume
- 7.85M
- Avg volume
- 7.43M
- Open
- 58.20
- Previous close
- 57.66
- Day's range
- 57.88 – 58.74
- 52-week range
- 53.35 – 67.56
- Beta
- 0.65
- Analysts
- Hold
- Price target
- 63.77 (+9.9%)
- Earnings date
- Feb 23, 2027
- 50-day average
- 56.69
Key statistics
- 200-day average
- 61.47
- Enterprise value
- 89.72B
- PEG ratio
- 2.94
- Price / sales
- 8.90
- Price / book
- 1.40
- Payout ratio
- 222.26%
- Revenue growth
- 10.20%
- Free cash flow
- 1.63B
- Total cash
- 403.13M
- Total debt
- 32.11B
- Return on equity
- 3.48%
- Short % of float
- 5.06%
Fundamental scorecard
12 of 25 checks passed on O’s reported financials
12of 25 checks passed
- Value 2 of 5
- Growth 4 of 5
- Profitability 3 of 5
- Financial health 0 of 5
- Dividend 3 of 5
Statements to Sep 30, 2026.
Analyst view
Consensus: hold
- Target (low)
- 59.00
- Target (mean)
- 63.77
- Target (high)
- 74.00
- Strong buy1
- Buy6
- Hold17
- Sell0
- Strong sell1
Next earnings
Feb 23, 2027
Expected Feb 23, 2027. Consensus EPS estimate 0.42592.
Financials — quick view
Earnings
| Report date | Quarter ending | EPS estimate | EPS reported | Surprise | Surprise % |
|---|---|---|---|---|---|
| Feb 23, 2027 | Dec 30, 2026 | 0.425 | — | — | — |
| Nov 2, 2026 | Sep 30, 2026 | 0.4068 | 0.43 | +0.02 | +5.70% |
| Aug 5, 2026 | Jun 30, 2026 | 0.3977 | 0.37 | -0.03 | -6.97% |
| May 6, 2026 | Mar 31, 2026 | 0.4026 | 0.33 | -0.07 | -18.03% |
| Feb 24, 2026 | Dec 31, 2025 | 0.3835 | 0.32 | -0.06 | -16.56% |
| Nov 3, 2025 | Sep 30, 2025 | 0.4045 | 0.345 | -0.06 | -14.71% |
Upgrades / downgrades
| Date | Firm | Action | From | To |
|---|---|---|---|---|
| Nov 16, 2026 | Wells Fargo | main | Equal-Weight | Equal-Weight |
| Nov 10, 2026 | Truist Securities | main | Hold | Hold |
| Nov 5, 2026 | Cantor Fitzgerald | main | Neutral | Neutral |
| Nov 3, 2026 | RBC Capital | main | Outperform | Outperform |
| Oct 20, 2026 | Barclays | main | Equal-Weight | Equal-Weight |
| Oct 19, 2026 | Wells Fargo | main | Equal-Weight | Equal-Weight |
About Realty Income Corporation
Realty Income Corporation, an S&P 500 company, is real estate partner to the world's leading companies. Founded in 1969, they serve their clients as a full-service real estate capital provider. As of June 30, 2026, they have a portfolio of over 15,500 properties in all 50 U.S. states, the U.K., and eight other countries in Europe. They are known as (The Monthly Dividend Company) and have a mission to invest in people and places to deliver dependable monthly dividends that increase over time. Since their founding, they have declared 676 consecutive monthly dividends and are a member of the S&P 500 Dividend Aristocrats index for having increased dividend for over 31 consecutive years. Realty Income Corporation was founded in 1969 and was incorporated in Maryland.
- Sector
- Real Estate
- Industry
- REIT - Retail
- Country
- United States
- Website
- realtyincome.com
News
 Don't Give Up on Realty Income in a Rising-Rate Environment; It Can Easily Survive Until the Property Market Adjusts
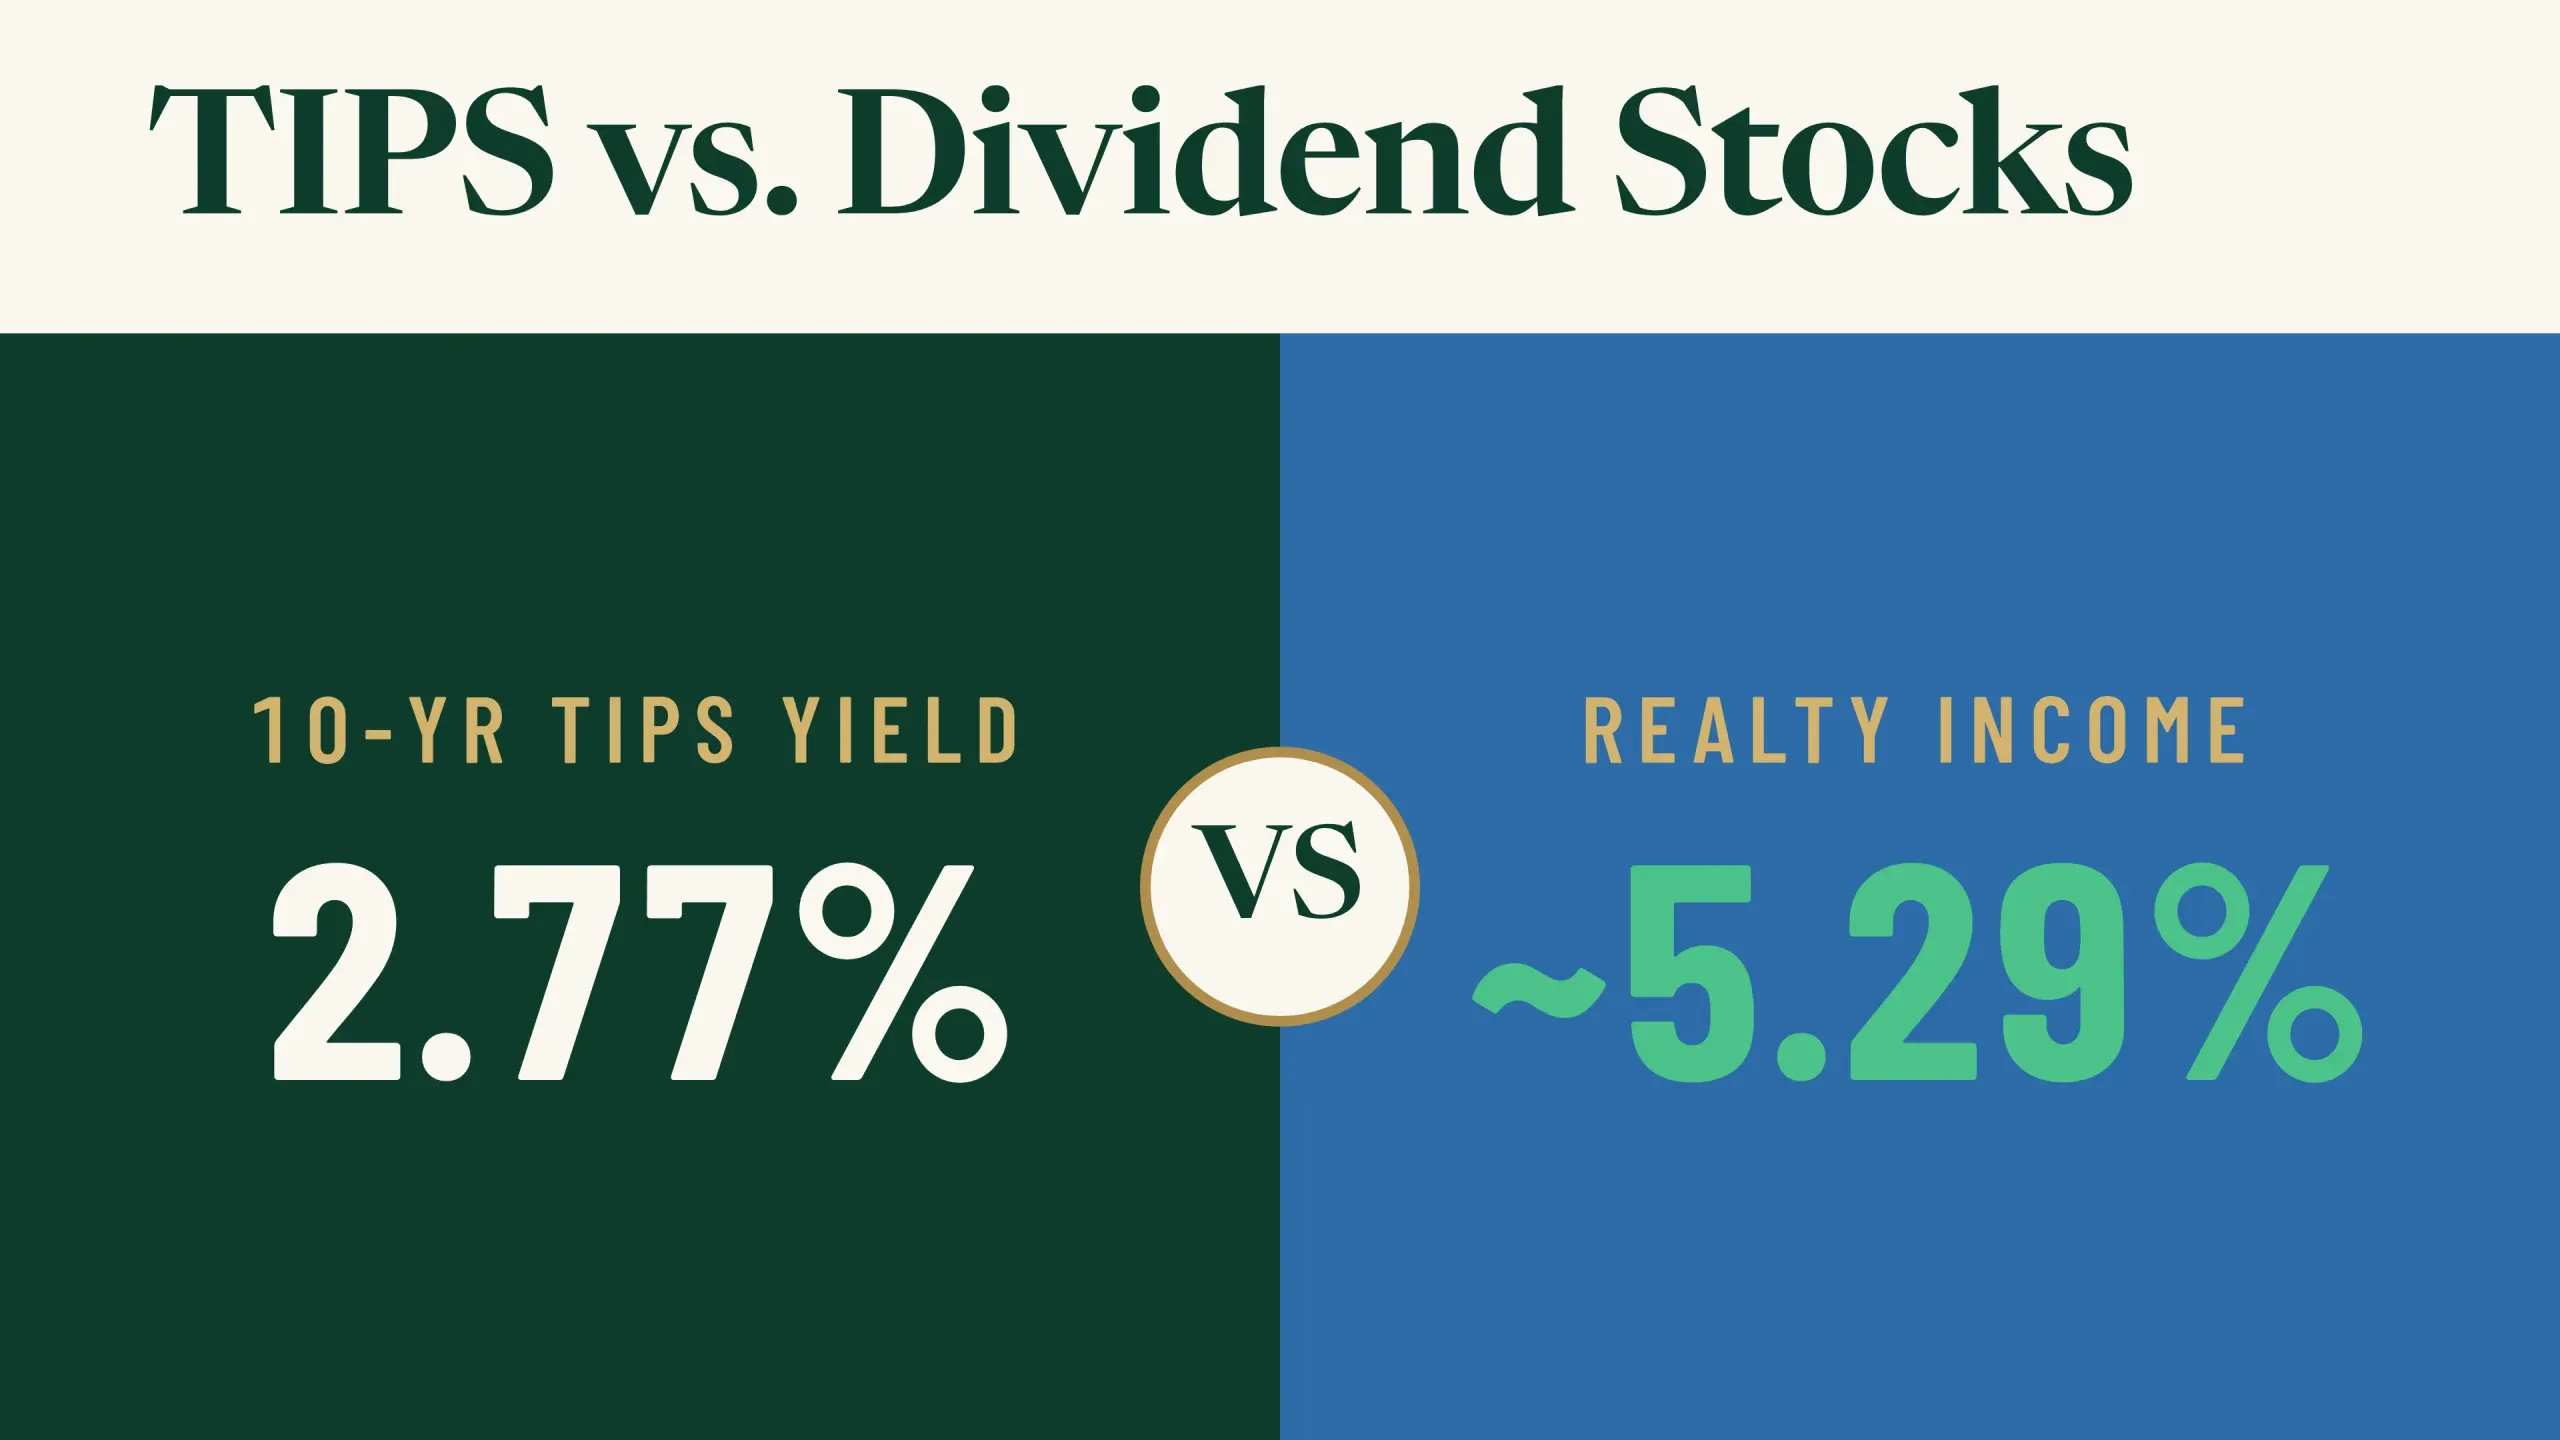 10-Year TIPS Pay 2.77% Above Inflation. Here’s How Dividend Stocks Compare
 Realty Income Pays Dividends Every Month. Here's What You Can Expect $10,000 Invested to Pay Monthly in 2027.
 Turn Your Roth IRA Into a Tax-Free Dividend Income Machine With These 3 Simple Moves
 4 High-Yield REITs Retirees Should Put on Their Buy List for Next Week
 I Wouldn't Dare Retire Without These 3 Dividend Machines
 REITs Have Struggled For Years: Why I'm Still Buying Them
 Realty Income: It's Still Too Early To Buy The First Rally Up
 How Retirees Can Turn $750,000 Into Passive Income With These 5 Dividend Stocks
 Realty Income Holds 98.8% Occupancy: Can Tenant Demand Stay Strong?
Your note
Sign in to keep a note on O — it syncs with the Stock Master app.
Insider holders
| Insider | Relation | Latest transaction | Date | Shares held |
|---|---|---|---|---|
| ABRAHAM NEIL M | Officer | Stock Award(Grant) | Feb 16, 2026 | 103,548 |
| BUSHORE MICHELLE | General Counsel | Sale | Apr 1, 2026 | 67,641 |
| GILYARD REGINALD HAROLD | Director | Stock Award(Grant) | May 20, 2026 | 34,846 |
| HAGAN MARK E. | Chief Investment Officer | Stock Award(Grant) | Feb 16, 2026 | 109,288 |
| HUSKINS PRIYA CHERIAN | Director | Stock Award(Grant) | May 20, 2026 | 0 |
| LOPEZ GERARDO I | Director | Stock Award(Grant) | May 20, 2026 | 34,846 |
Institution ownership
| Holder | % held | Shares | Value | Reported |
|---|---|---|---|---|
| Blackrock Inc. | 12.01% | 114,221,764 | 6.63B | Sep 29, 2026 |
| Vanguard Portfolio Management LLC | 8.63% | 82,038,191 | 4.76B | Sep 29, 2026 |
| State Street Corporation | 7.11% | 67,614,035 | 3.92B | Sep 29, 2026 |
| Vanguard Capital Management LLC | 6.50% | 61,814,052 | 3.59B | Sep 29, 2026 |
| Geode Capital Management, LLC | 3.38% | 32,146,487 | 1.87B | Sep 29, 2026 |
| Bank of America Corporation | 1.95% | 18,574,940 | 1.08B | Sep 29, 2026 |
Fund ownership
| Holder | % held | Shares | Value | Reported |
|---|---|---|---|---|
| VANGUARD SPECIALIZED FUNDS-Vanguard Real Estate Index Fund | 3.70% | 35,201,054 | 2.04B | Jul 30, 2026 |
| VANGUARD INDEX FUNDS-Vanguard Total Stock Market Index Fund | 3.11% | 29,600,189 | 1.72B | Jun 29, 2026 |
| VANGUARD INDEX FUNDS-Vanguard 500 Index Fund | 2.54% | 24,169,828 | 1.40B | Jun 29, 2026 |
| VANGUARD INDEX FUNDS-Vanguard Mid-Cap Index Fund | 2.12% | 20,204,974 | 1.17B | Jun 29, 2026 |
| iShares Trust-iShares Core S&P 500 ETF | 1.33% | 12,608,571 | 731.68M | Sep 29, 2026 |
| Fidelity Concord Street Trust-Fidelity 500 Index Fund | 1.29% | 12,297,020 | 713.60M | Sep 29, 2026 |