

Getty Realty Corp. GTY
28.36 USD +0.06 (+0.21%)
Regular-session close
28.36 0.00 0.00%
After hours · Nov 20, 4:01 PM ET
28.31 Day range 28.95
27.08 52-week range 36.83
- YTD
- +3.62%
- 1 year
- +1.00%
No chart data for this range yet.
- Market cap
- 1.90B
- Revenue (ttm)
- 240.43M
- Profit margin
- 42.37%
- EPS (ttm)
- 1.64
- Shares out
- 67.12M
- P/E ratio
- 17.29
- Forward P/E
- 19.45
- Dividend
- 2.00 (7.07%)
- Ex-dividend date
- Dec 24, 2026
- YTD return
- +3.62%
- 1-year return
- +1.00%
- Volume
- 460.65K
- Avg volume
- 608.32K
- Open
- 28.41
- Previous close
- 28.30
- Day's range
- 28.31 – 28.95
- 52-week range
- 27.08 – 36.83
- Beta
- 0.71
- Analysts
- Buy
- Price target
- 33.86 (+19.4%)
- Earnings date
- Feb 10, 2027
- 50-day average
- 28.62
Key statistics
- 200-day average
- 32.07
- Enterprise value
- 3.10B
- PEG ratio
- 1.27
- Price / sales
- 7.92
- Price / book
- 1.49
- Payout ratio
- 118.29%
- Revenue growth
- 13.30%
- Free cash flow
- 106.93M
- Total cash
- 8.83M
- Total debt
- 1.21B
- Return on equity
- 8.90%
- Short % of float
- 7.56%
Fundamental scorecard
14 of 25 checks passed on GTY’s reported financials
14of 25 checks passed
- Value 4 of 5
- Growth 3 of 5
- Profitability 3 of 5
- Financial health 1 of 5
- Dividend 3 of 5
Statements to Sep 30, 2026.
Analyst view
Consensus: buy
Buy
Price target (mean) 33.86 +19.4% upside
Now 28.36
- Target (low)
- 30.00
- Target (mean)
- 33.86
- Target (high)
- 37.00
Ratings (0m) 8 3 buy · 5 hold · 0 sell
- Strong buy1
- Buy2
- Hold5
- Sell0
- Strong sell0
Next earnings
Feb 10, 2027
Expected Feb 10, 2027. Consensus EPS estimate 0.33751.
Financials — quick view
GTY Revenue — quarterly 63.18M
GTY Net income — quarterly 25.61M
GTY EPS — quarterly 0.40
Earnings
| Report date | Quarter ending | EPS estimate | EPS reported | Surprise | Surprise % |
|---|---|---|---|---|---|
| Feb 10, 2027 | Dec 30, 2026 | 0.3602 | — | — | — |
| Oct 21, 2026 | Sep 30, 2026 | 0.3453 | 0.40 | +0.05 | +15.84% |
| Jul 22, 2026 | Jun 30, 2026 | 0.3703 | 0.36 | -0.01 | -2.78% |
| Apr 22, 2026 | Mar 31, 2026 | 0.3614 | 0.44 | +0.08 | +21.75% |
| Feb 11, 2026 | Dec 31, 2025 | 0.3426 | 0.47 | +0.13 | +37.19% |
| Oct 22, 2025 | Sep 30, 2025 | 0.3476 | 0.41 | +0.06 | +17.95% |
Upgrades / downgrades
| Date | Firm | Action | From | To |
|---|---|---|---|---|
| Sep 24, 2026 | Keybanc | reit | Overweight | Overweight |
| Sep 1, 2026 | Citizens | reit | Market Outperform | Market Outperform |
| Jul 24, 2026 | RBC Capital | main | Sector Perform | Sector Perform |
| Jul 23, 2026 | Baird | main | Neutral | Neutral |
| Jul 23, 2026 | Citizens | main | Market Outperform | Market Outperform |
| May 14, 2026 | Keybanc | main | Overweight | Overweight |
About Getty Realty Corp.
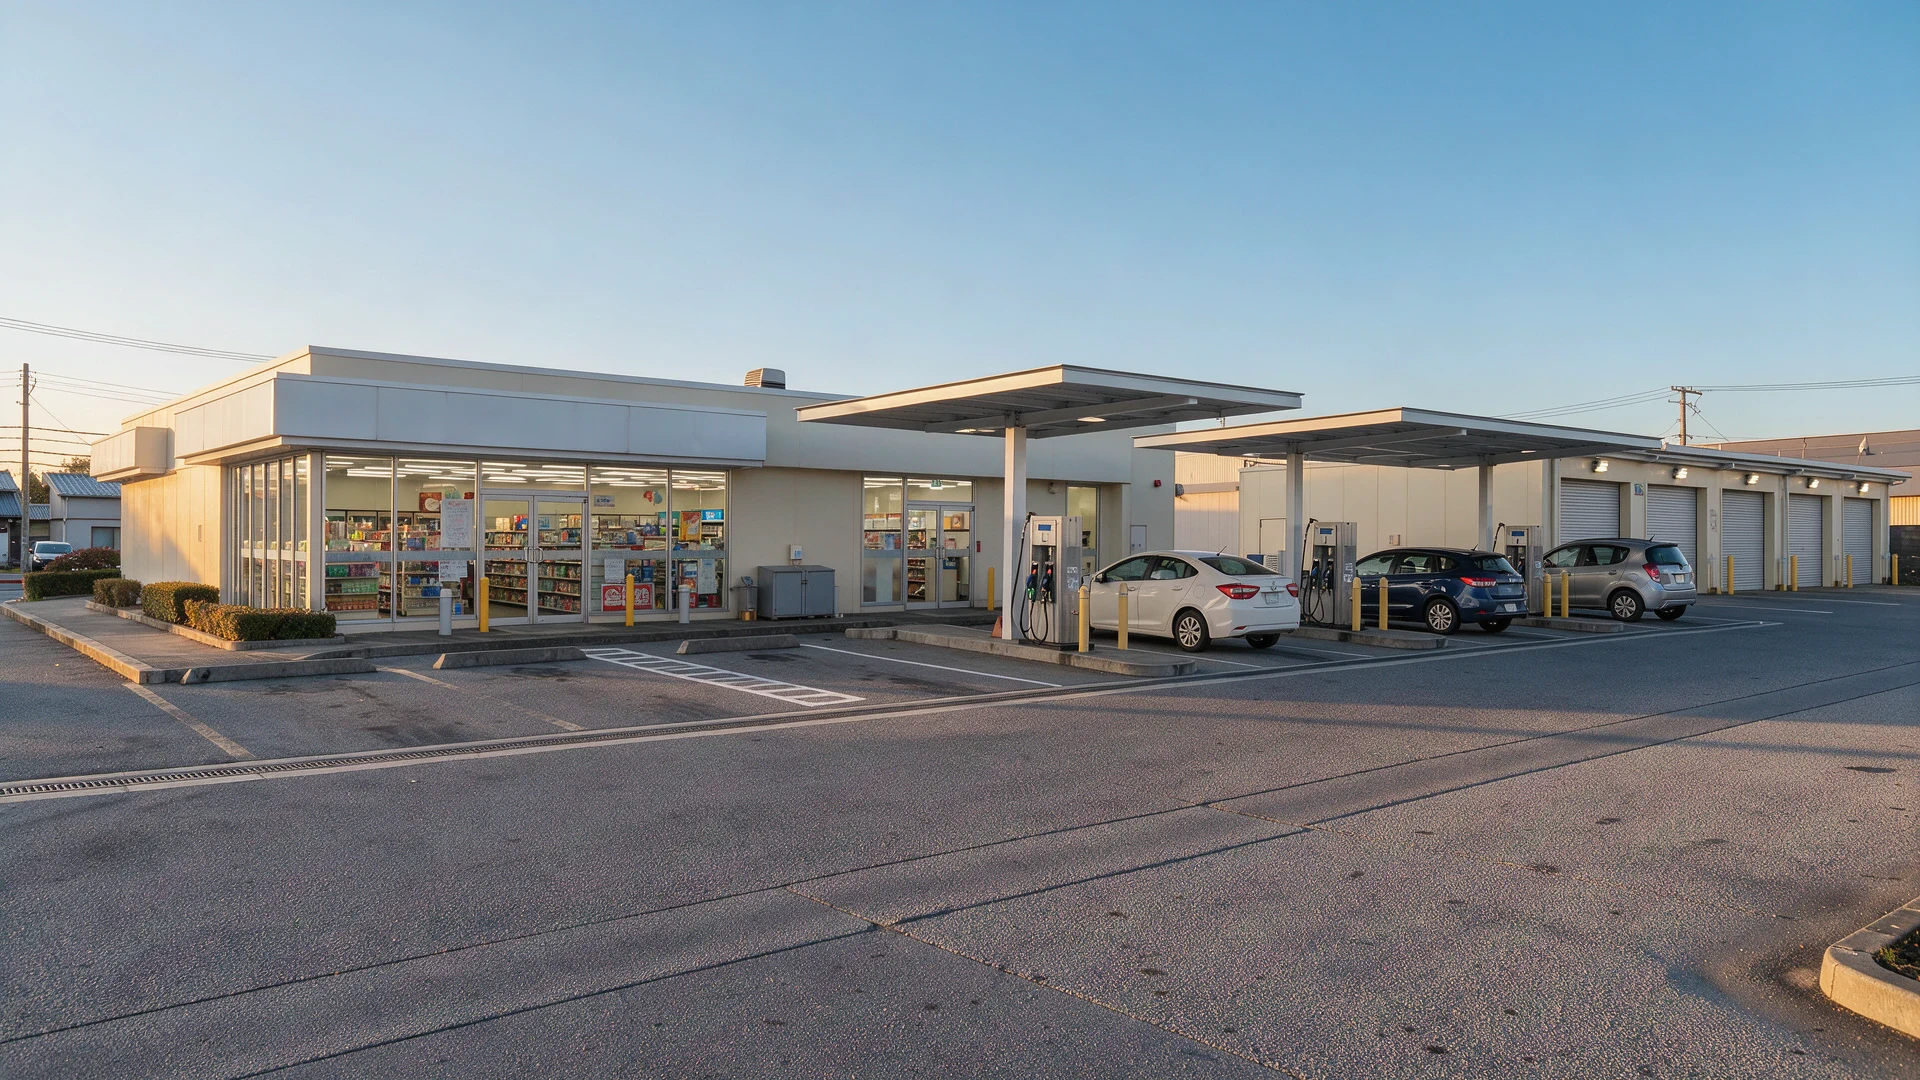
Getty Realty Corp. is a publicly traded, net lease REIT specializing in the acquisition, financing and development of convenience, automotive and other single-tenant retail real estate. As of June 30, 2026, the Company's portfolio included 1,224 freestanding properties located in 46 states across the United States and Washington, D.C. Getty Realty Corp. was incorporated in 1955 and is based in New York, United States.
- Sector
- Real Estate
- Industry
- REIT - Retail
- Country
- United States
- Website
- gettyrealty.com
News
 Buried Treasures: 6 Strong, Undervalued High-Yield REITs
 The Roth IRA Portfolio That Pays $5,825 a Month Without Selling a Single Share
 Small Caps Are Wobbling. These Dividend Stocks Are Solid Buys.
 Getty Realty Q3 2026 Earnings Call Transcript
 Getty Realty Q3 FFO $0.64 Beats $0.63 Estimate, Sales $62.990M Beat $59.441M Estimate
 Getty Realty Raises Dividend From $0.48 To $0.50 Per Share
Your note
Sign in to keep a note on GTY — it syncs with the Stock Master app.
Insider holders
| Insider | Relation | Latest transaction | Date | Shares held |
|---|---|---|---|---|
| CONSTANT CHRISTOPHER J | Chief Executive Officer | Stock Award(Grant) | Dec 17, 2025 | 1,242 |
| COOPER MILTON | Director | Conversion of Exercise of derivative security | Mar 2, 2025 | 56,077 |
| COVIELLO PHILIP E JR | Director | Conversion of Exercise of derivative security | Mar 2, 2025 | 0 |
| DICKER JOSHUA | General Counsel | Stock Award(Grant) | Dec 17, 2025 | 331 |
| DICKMAN BRIAN ROBERT | Chief Financial Officer | Stock Award(Grant) | Dec 17, 2025 | 120 |
| OLEAR MARK JAMES | Officer | Stock Award(Grant) | Dec 17, 2025 | 220 |
Institution ownership
| Holder | % held | Shares | Value | Reported |
|---|---|---|---|---|
| Blackrock Inc. | 15.80% | 10,608,341 | 301.06M | Sep 29, 2026 |
| Vanguard Portfolio Management LLC | 8.76% | 5,877,080 | 166.79M | Sep 29, 2026 |
| State Street Corporation | 6.86% | 4,602,422 | 130.62M | Sep 29, 2026 |
| Kayne Anderson Rudnick Investment Management LLC | 4.33% | 2,906,691 | 82.49M | Sep 29, 2026 |
| Vanguard Capital Management LLC | 3.90% | 2,618,678 | 74.32M | Sep 29, 2026 |
| Two Sigma Investments, LP | 2.99% | 2,008,695 | 57.01M | Sep 29, 2026 |
Fund ownership
| Holder | % held | Shares | Value | Reported |
|---|---|---|---|---|
| iShares Trust-iShares Core S&P Small-Cap ETF | 5.16% | 3,464,324 | 98.32M | Sep 29, 2026 |
| VANGUARD SPECIALIZED FUNDS-Vanguard Real Estate Index Fund | 3.22% | 2,162,062 | 61.36M | Jul 30, 2026 |
| VANGUARD INDEX FUNDS-Vanguard Total Stock Market Index Fund | 2.86% | 1,917,558 | 54.42M | Jun 29, 2026 |
| iShares Trust-iShares Russell 2000 ETF | 2.30% | 1,542,139 | 43.77M | Sep 29, 2026 |
| VANGUARD INDEX FUNDS-Vanguard Small-Cap Index Fund | 2.06% | 1,385,548 | 39.32M | Jun 29, 2026 |
| SPDR-EUROPE-SSgA SPDR ETFS Europe I-SPDR S&P Glbl Div Aristocrats UCIT | 1.47% | 988,029 | 28.04M | Sep 29, 2026 |