

XPeng Inc. XPEV
9.94 USD -0.05 (-0.50%)
As ofNov 18, 2026, 10:41 AM EST
9.90 Day range 10.18
8.94 52-week range 22.23
- YTD
- -50.99%
- 1 year
- -56.06%
- Market cap
- 9.53B
- Revenue (ttm)
- 79.31B
- Profit margin
- -4.55%
- EPS (ttm)
- -0.55
- Shares out
- 783.62M
- Forward P/E
- -51.15
- YTD return
- -50.99%
- 1-year return
- -56.06%
- 50-day average
- 9.80
- 200-day average
- 13.94
- Volume
- 2.67M
- Avg volume
- 7.51M
- Open
- 10.02
- Previous close
- 9.99
- Day's range
- 9.90 – 10.18
- 52-week range
- 8.94 – 22.23
- Beta
- 0.98
- Analysts
- Buy
- Price target
- 17.02 (+71.3%)
- Earnings date
- Mar 19, 2027
5D +0.43 (+4.52%)
Key statistics
- Enterprise value
- 6.64B
- Price / sales
- 0.12
- Price / book
- 2.40
- Revenue growth
- 19.10%
- Total cash
- 32.86B
- Total debt
- 27.72B
- Return on equity
- -12.20%
- Short % of float
- 6.04%
Fundamental scorecard
9 of 25 checks passed on XPEV’s reported financials
9of 25 checks passed
- Value 2 of 5
- Growth 3 of 5
- Profitability 1 of 5
- Financial health 3 of 5
- Dividend No data
Statements to Jun 30, 2026.
Analyst view
Consensus: buy
Buy
Price target (mean) 17.02 +71.3% upside
Now 9.94
- Target (low)
- 8.00
- Target (mean)
- 17.02
- Target (high)
- 25.39
Ratings (0m) 25 19 buy · 4 hold · 2 sell
- Strong buy6
- Buy13
- Hold4
- Sell0
- Strong sell2
Next earnings
Mar 19, 2027
Expected Mar 19, 2027. Consensus EPS estimate 0.03.
Financials — quick view
XPEV Revenue — quarterly 19.74B
XPEV Net income — quarterly -1.34B
XPEV EPS — quarterly -1.40
Earnings
| Report date | Quarter ending | EPS estimate | EPS reported | Surprise | Surprise % |
|---|---|---|---|---|---|
| Mar 19, 2027 | Dec 30, 2026 | -0.07847 | — | — | — |
| Nov 16, 2026 | Sep 30, 2026 | -0.11071 | -0.14 | -0.03 | -26.46% |
| Aug 24, 2026 | Jun 30, 2026 | -0.0596 | -0.21 | -0.15 | -252.35% |
| May 28, 2026 | Mar 31, 2026 | -0.11125 | -0.27102 | -0.16 | -143.61% |
| Mar 20, 2026 | Dec 31, 2025 | 0.00139 | 0.06 | +0.06 | +4,216.55% |
| Nov 17, 2025 | Sep 30, 2025 | -0.00793 | -0.06 | -0.05 | -656.62% |
Upgrades / downgrades
| Date | Firm | Action | From | To |
|---|---|---|---|---|
| Nov 17, 2026 | Freedom Broker | main | Buy | Buy |
| Nov 17, 2026 | Bernstein | main | Market Perform | Market Perform |
| Oct 26, 2026 | JP Morgan | main | Neutral | Neutral |
| Sep 29, 2026 | JP Morgan | down | Overweight | Neutral |
| Aug 26, 2026 | Barclays | main | Underweight | Underweight |
| Aug 25, 2026 | JP Morgan | main | Overweight | Overweight |
About XPeng Inc.
XPeng Inc. operates as a physical AI company. It has developed a Physical AI architecture covering Turing AI chips, foundation models, and integrated software and hardware applications. The company's products include smart EVs, robotaxis, and humanoid robots. XPeng Inc. was founded in 2015 and is headquartered in Guangzhou, the People's Republic of China.
- Sector
- Consumer Cyclical
- Industry
- Auto Manufacturers
- Country
- China
- Website
- xpeng.com
News
 Barclays Maintains Underweight on XPeng, Lowers Price Target to $12
 Freedom Broker Maintains Buy on XPeng, Lowers Price Target to $20
 Bernstein Maintains Market Perform on XPeng, Lowers Price Target to $15
 XPENG Reports Q3 2026 Results: Both Deliveries and Revenue Reach Record Highs, Overseas Market 2026 Full-Year Sales Target Exceeds 100,000 Units
 XPeng Inc. (XPEV) Q3 2026 Earnings Call Transcript
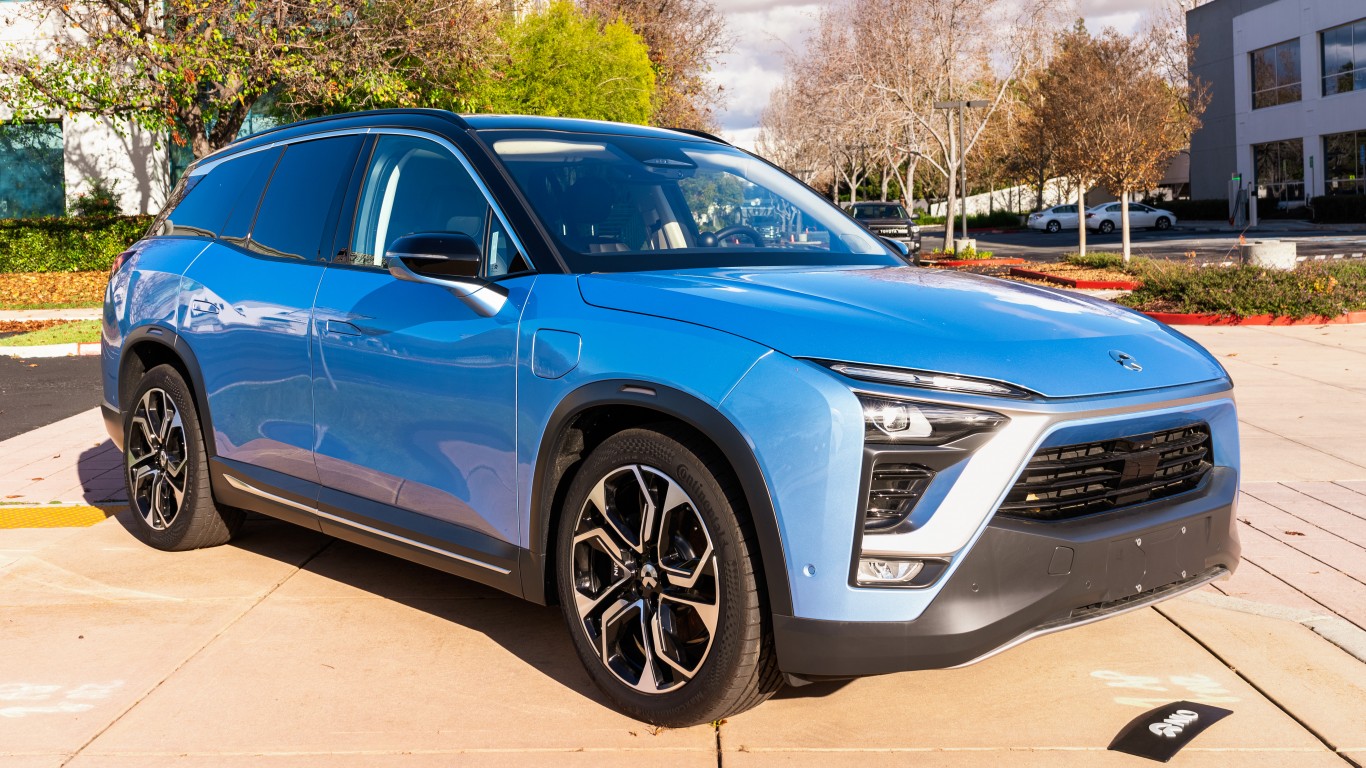 XPeng Rallies 5% on Q3 Results and Strong Q4 Delivery Outlook; Nio Falls 4%, Tesla Slides 3%
 What XPENG (XPEV) Said on Its Q3 Earnings Call
 XPeng CEO Bets Its Humanoid Robots Could Outsell Industry's Hottest Luxury EVs
 XPeng Stock Jump After Earnings. EVs, Though, Are Still Losing Money.
 XPeng's Net Loss Widens Amid Subdued Chinese Auto Market
Your note
Sign in to keep a note on XPEV — it syncs with the Stock Master app.
Institution ownership
| Holder | % held | Shares | Value | Reported |
|---|---|---|---|---|
| Alibaba Group Holding Ltd | 3.84% | 30,127,580 | 300.97M | Sep 29, 2026 |
| Primecap Management Company | 1.58% | 12,388,667 | 123.76M | Sep 29, 2026 |
| Morgan Stanley | 1.43% | 11,188,425 | 111.77M | Sep 29, 2026 |
| TMT General Partner Ltd | 1.31% | 10,285,837 | 102.76M | Sep 29, 2026 |
| UBS Group AG | 1.08% | 8,479,308 | 84.71M | Sep 29, 2026 |
| Primavera Capital Management Ltd | 0.42% | 3,306,567 | 33.03M | Sep 29, 2026 |
Fund ownership
| Holder | % held | Shares | Value | Reported |
|---|---|---|---|---|
| VANGUARD HORIZON FUNDS-Vanguard Capital Opportunity Fund | 1.05% | 8,237,719 | 82.29M | Jun 29, 2026 |
| Exch TRADED CONCEPTS TRT-ROBO Global Robotics and Automation Index ETF | 0.35% | 2,762,104 | 27.59M | Oct 30, 2026 |
| PRIMECAP Odyssey Funds-PRIMECAP Odyssey Aggressive Growth Fund | 0.33% | 2,614,190 | 26.12M | Sep 29, 2026 |
| BARON SELECT FUNDS-Baron Emerging Markets Fund | 0.12% | 946,973 | 9.46M | Jun 29, 2026 |
| SPDR SERIES TRT-State Street SPDR S&P Kensho New Economies Composite E | 0.08% | 639,983 | 6.39M | Sep 29, 2026 |
| Invesco Exchange-Traded Fund Trust-Invesco WilderHill Clean Energy ETF | 0.07% | 528,495 | 5.28M | Aug 30, 2026 |