

USCF Midstream Energy Income Fund UMI
56.46 USD -1.56 (-2.69%)
At closeNov 5, 2026, 7:41 PM EST
56.04 -0.42 -0.74%
After hours · Nov 5, 7:41 PM ET
56.24 Day range 58.30
48.05 52-week range 64.77
- YTD
- +15.04%
- 1 year
- +16.85%
- Market cap
- 523.88M
- EPS (ttm)
- 3.07
- P/E ratio
- 18.40
- YTD return
- +15.04%
- 1-year return
- +16.85%
- Volume
- 46.75K
- Avg volume
- 26.38K
- Open
- 58.11
- Previous close
- 58.02
- Day's range
- 56.24 – 58.30
- 52-week range
- 48.05 – 64.77
1Y +9.70 (+20.07%)
Key statistics
- Enterprise value
- 0
- PEG ratio
- 0.00
- Price / sales
- 0.00
- Price / book
- 0.00
- Dividend yield
- 0.00%
- Payout ratio
- 0.00%
- Short % of float
- 0.00%
- 50-day average
- 49.56
- 200-day average
- 43.99
About USCF Midstream Energy Income Fund
The fund will seek to achieve its investment objectives by investing, under normal market conditions, at least 80% of its net assets in equity securities of U.S. and Canadian companies of any market capitalization deemed by the Sub-Adviser to be engaged in the midstream energy sector. It will invest more than 25% of the value of its total assets in the energy, oil, and gas industries. The fund is non-diversified.
News
 Upstart Publishes September 2026 Originations and Latest UMI
 UMI: The Midstream Energy Income ETF Delivered Outperformance, And Its Future Looks Bright
 Upstart Publishes July 2026 Originations and Latest UMI
 UMI: This Midstream Fund Could Be Better Than Bonds
 Forget Your Savings Account. These 3 Monthly Dividend ETFs Pay 10x More
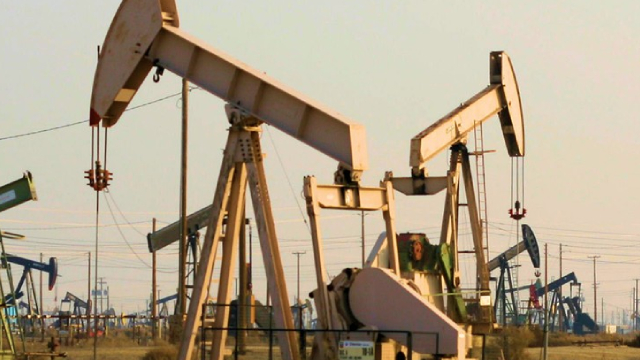 Buy This ETF if You Want to Benefit From High Oil Prices Without Wild Swings
 This ETF Gives You Oil's Upside, minus the Downside Risk
 3 Midstream Dividend ETFs Yielding Over 5% That Are Also Beating the Market
 UMI: Decent Performance, But Low Oil Prices Could Be An Issue Going Forward
 UMI: This Overlooked Energy ETF Is Quietly Crushing The Market
Your note
Sign in to keep a note on UMI — it syncs with the Stock Master app.