

Unilever PLC UL
Nov 3, 2026, 3:30 PM EST
- YTD
- -0.63%
- 1 year
- -4.88%
- Market cap
- 139.97B
- Revenue (ttm)
- 50.62B
- Profit margin
- 18.32%
- EPS (ttm)
- 4.95
- Shares out
- 2.15B
- P/E ratio
- 13.13
- Forward P/E
- 17.18
- Dividend
- 2.09 (3.28%)
- Ex-dividend date
- Nov 12, 2026
- YTD return
- -0.63%
- 1-year return
- -4.88%
- Volume
- 2.36M
- Avg volume
- 3.54M
- Open
- 65.47
- Previous close
- 66.44
- Day's range
- 64.99 – 65.59
- 52-week range
- 54.75 – 74.98
- Beta
- 0.47
- Analysts
- Buy
- Price target
- 73.15 (+12.6%)
- Earnings date
- Feb 11, 2027
5D +1.45 (+2.28%)
Key statistics
- Enterprise value
- 168.80B
- PEG ratio
- 6.95
- Price / sales
- 2.83
- Price / book
- 7.87
- Dividend yield
- 3.20%
- Payout ratio
- 46.43%
- Revenue growth
- 0.50%
- Free cash flow
- 6.73B
- Total cash
- 5.94B
- Total debt
- 32.11B
- Return on equity
- 31.87%
- Short % of float
- 0.00%
- 50-day average
- 63.35
- 200-day average
- 62.56
Analyst view
Consensus: buy
- Target (low)
- 70.33
- Target (mean)
- 73.15
- Target (high)
- 76.33
- Strong buy0
- Buy3
- Hold2
- Sell0
- Strong sell0
Next earnings
Feb 11, 2027
Expected Feb 11, 2027. Consensus EPS estimate 0.00.
Financials — quick view
Earnings
| Report date | Quarter ending | EPS estimate | EPS reported | Surprise | Surprise % |
|---|---|---|---|---|---|
| Feb 11, 2027 | Dec 30, 2026 | 1.83 | — | — | — |
| Jul 28, 2026 | Jun 30, 2026 | 1.84 | 1.83 | -0.01 | -0.54% |
| Feb 12, 2026 | Dec 31, 2025 | 1.75 | 1.37 | -0.38 | -21.71% |
| Jul 31, 2025 | Jun 30, 2025 | 1.83 | 1.67 | -0.16 | -8.74% |
| Feb 13, 2025 | Dec 31, 2024 | 1.53 | 0.845 | -0.68 | -44.77% |
| Jul 25, 2024 | Jun 30, 2024 | 1.67 | 1.58 | -0.09 | -5.39% |
Upgrades / downgrades
| Date | Firm | Action | From | To |
|---|---|---|---|---|
| Oct 13, 2026 | TD Cowen | main | Buy | Buy |
| Aug 21, 2025 | CICC | init | — | Outperform |
| Nov 19, 2024 | Erste Group | down | Buy | Hold |
| Aug 22, 2024 | B of A Securities | up | Underperform | Buy |
| May 23, 2024 | JP Morgan | up | Underweight | Overweight |
| May 8, 2024 | Argus Research | main | Buy | Buy |
About Unilever PLC
Unilever PLC operates as a fast-moving consumer goods company in the Asia Pacific, Africa, the Americas, and Europe. It operates through four segments: Beauty & Wellbeing, Personal Care, Home Care, and Foods. The Beauty & Wellbeing segment offers hair care, such as shampoo, conditioner, and styling; face, hand, and body moisturizer skin care products; and Prestige Beauty and Wellbeing products. The Personal Care segment provides soap and shower skin cleansing products; and deodorant and oral care, including toothpaste, toothbrush, and mouthwash products. The Home Care segment offers washing powders and liquids, and rinse conditioner fabric care products; and a range of home and hygiene cleaning products. The Foods segment provides cooking aids and mini meals comprising soups, bouillons, and seasonings, as well as mayonnaise and ketchup condiments; and Unilever food solutions. The company provides its products under the AXE, Clear, Cif, Closeup, Comfort, Dermalogica, Domestos, Dove, Dove Men+Care, Hellmann's, Horlicks, Knorr, LUX, Lifebuoy, Liquid I.V., Nexxus, Nutrafol, OMO, Pond's, Paula's Choice, Pepsodent, Radiant, Rexona, Sunlight, Sunsilk, Surf, TRESemmé, and Vaseline brand names. Unilever PLC was founded in 1860 and is headquartered in London, the United Kingdom.
- Sector
- Consumer Defensive
- Industry
- Household & Personal Products
- Country
- United Kingdom
- Website
- unilever.com
News
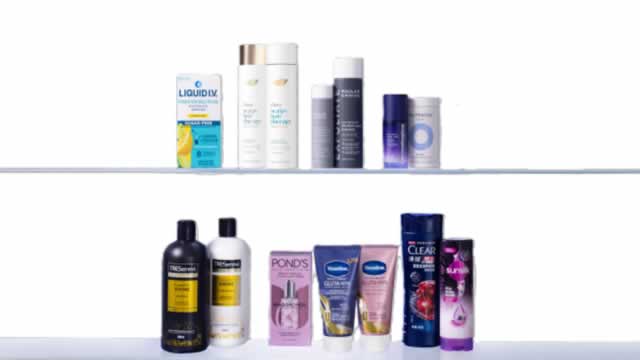 Unilever Eyes $1.1 Billion in Savings as It Plans Leaner Future Away From Food
 Unilever targets $1.12 billion in savings as it reshapes
 Clorox Names Unilever's Fabian Garcia as CEO
 Unilever PLC (UL) Q3 2026 Sales/Trading Call Transcript
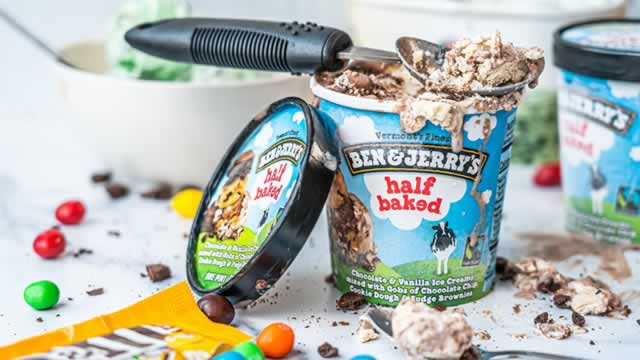 Unilever Brightens Volume Outlook After Sales Rise
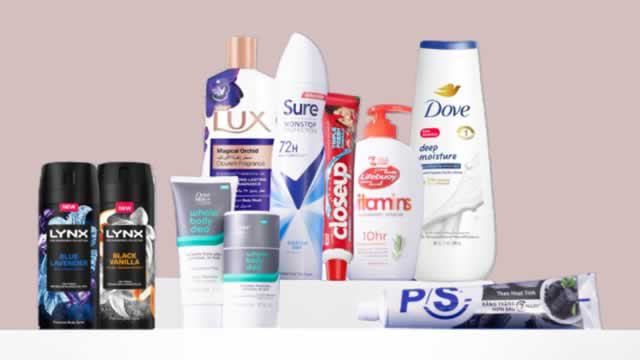 Dove maker Unilever beats quarterly sales estimates on strong demand, pricing
 Dutch regulator blocks takeover of Unilever's Unox brand
 Split $5,000 Across These 5 Dividend Stocks and Don't Look Until 2031
 Unilever Named #1 Core Non-Food Supplier Across All Channels in 2026 Advantage Awards
 4 Top Dividend Stocks Yielding 4% or More to Buy Right Now for Passive Income
Your note
Sign in to keep a note on UL — it syncs with the Stock Master app.
Insider holders
| Insider | Relation | Latest transaction | Date | Shares held |
|---|---|---|---|---|
| Lu (Ruby) | — | Bought | Jun 7, 2026 | 8,915 |
| McKenna (Judith J) | — | Bought | May 28, 2026 | 4,295 |
Institution ownership
| Holder | % held | Shares | Value | Reported |
|---|---|---|---|---|
| Wellington Management Group, LLP | 1.63% | 35,063,391 | 2.33B | Jun 29, 2026 |
| Fisher Asset Management, LLC | 1.15% | 24,693,472 | 1.64B | Jun 29, 2026 |
| Morgan Stanley | 0.45% | 9,665,376 | 642.31M | Jun 29, 2026 |
| FMR, LLC | 0.42% | 9,006,011 | 598.49M | Jun 29, 2026 |
| GQG Partners LLC | 0.40% | 8,673,777 | 576.42M | Jun 29, 2026 |
| Price (T.Rowe) Associates Inc | 0.38% | 8,143,219 | 541.16M | Jun 29, 2026 |
Fund ownership
| Holder | % held | Shares | Value | Reported |
|---|---|---|---|---|
| VANGUARD FENWAY FUNDS-Vanguard Equity Income Fund | 0.64% | 13,851,721 | 920.52M | Jun 29, 2026 |
| VANGUARD WELLESLEY INCOME FUND | 0.27% | 5,755,280 | 382.47M | Jun 29, 2026 |
| HARTFORD MUTUAL FUNDS INC/CT-THE HARTFORD DIVIDEND AND GROWTH FUND | 0.25% | 5,318,226 | 353.42M | Jul 30, 2026 |
| ADVISORS' INNER CIRCLE III-GQG PARTNERS EMERGING MARKETS EQUITY FUND | 0.24% | 5,207,689 | 346.08M | Jun 29, 2026 |
| John Hancock Investment Trust-International Dynamic Growth Fund | 0.10% | 2,256,200 | 149.94M | Aug 30, 2026 |
| VANGUARD WINDSOR FUNDS-Vanguard Windsor II Fund | 0.08% | 1,685,664 | 112.02M | Jul 30, 2026 |