

Tennessee Valley Authority TVC
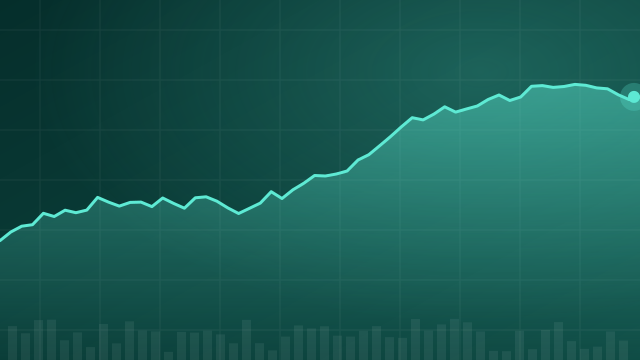
23.89 USD -0.02 (-0.08%)
Nov 3, 2026, 3:47 PM EST
23.83 Day range 23.92
23.62 52-week range 24.57
- YTD
- -0.67%
- 1 year
- -0.79%
- Market cap
- 11.96M
- Revenue (ttm)
- 12.18B
- Profit margin
- 8.41%
- Shares out
- 525.00K
- YTD return
- -0.67%
- 1-year return
- -0.79%
- Volume
- 2.91K
- Avg volume
- 9.91K
- Open
- 23.83
- Previous close
- 23.91
- Day's range
- 23.83 – 23.92
- 52-week range
- 23.62 – 24.57
2Y +0.96 (+4.19%)
Key statistics
- Enterprise value
- 0
- PEG ratio
- 0.00
- Price / sales
- 0.00
- Price / book
- 0.00
- Dividend yield
- 0.00%
- Payout ratio
- 0.00%
- Revenue growth
- 6.70%
- Free cash flow
- 279.75M
- Total cash
- 501.00M
- Total debt
- 22.55B
- Return on equity
- 6.35%
- Short % of float
- 0.00%
- 50-day average
- 22.88
- 200-day average
- 22.61
Next earnings
Consensus EPS estimate 0.00.
About Tennessee Valley Authority
Tennessee Valley Authority generates power from coal, nuclear, hydroelectric, natural gas, and renewable sources. Tennessee Valley Authority was founded in 1933 and is headquartered in Knoxville, Tennessee.
- Country
- United States
- Website
- tva.com
News
 Three Valley Copper Corp. Announces Extension of Loan Agreement
 'TVA to Buy Advanced Nuclear Power for Google Data Centers'- Bloomberg
 Tennessee Valley Authority CEO Jeffrey J. Lyash To Retire By October 2, 2025
 Tennessee Valley Authority Baby Bonds: Riding The Yield Curve
 The Veterinary Cooperative (TVC) and Wedgewood's Blue Rabbit Platform Announce New Partnership to Offer Best-in-Class Veterinary Home Delivery Services
 The Veterinary Cooperative (TVC) Announces New Partnership with Otto to Optimize Veterinary Workflow and Boost Efficiency
 Tennessee Valley Authority PARRS A 2029 (TVE) Q2 2024 Earnings Call Transcript
 Earnings Scheduled For January 31, 2023
 Tennessee Valley Authority PARRS A 2029 (TVE) Q4 2022 Earnings Call Transcript
 Market Scenario Analysis, Trends By 2030
Your note
Sign in to keep a note on TVC — it syncs with the Stock Master app.
Institution ownership
| Holder | % held | Shares | Value | Reported |
|---|---|---|---|---|
| IAT Reinsurance Co Ltd | 0.52% | 120,000 | 2.73M | Sep 29, 2024 |
| Summit Financial, LLC | 0.16% | 37,606 | 856.66K | Sep 29, 2024 |
Fund ownership
| Holder | % held | Shares | Value | Reported |
|---|---|---|---|---|
| iShares Preferred & Income Securities ETF | 4.29% | 987,239 | 22.49M | Sep 29, 2024 |
| VanEck ETF Trust-VanEck Preferred Securities ex Financials ETF | 1.81% | 416,513 | 9.49M | Oct 30, 2024 |
| Global X Fds-Global X U.S. Preferred ETF | 0.89% | 205,575 | 4.68M | Oct 30, 2024 |
| SPDR (R) Ser Tr-SPDR ICE Preferred Securities ETF | 0.56% | 128,939 | 2.94M | Sep 29, 2024 |
| Global X Fds-Global X Variable Rate Preferred ETF | 0.47% | 107,679 | 2.45M | Oct 30, 2024 |
| Invesco ETF Tr II-Invesco Variable Rate Preferred ETF | 0.36% | 82,800 | 1.89M | Oct 30, 2024 |