

Invesco S&P 500 High Dividend Low Volatility ETF SPHD
52.82 USD +0.08 (+0.15%)
At closeNov 10, 2026, 7:52 PM EST
52.79 -0.04 -0.07%
After hours · Nov 10, 7:52 PM ET
52.23 Day range 53.00
47.26 52-week range 54.04
- YTD
- +10.04%
- 1 year
- +10.73%
- Market cap
- 3.47B
- EPS (ttm)
- 3.31
- P/E ratio
- 15.98
- YTD return
- +10.04%
- 1-year return
- +10.73%
- Volume
- 1.21M
- Avg volume
- 1.05M
- Open
- 52.52
- Previous close
- 52.74
- Day's range
- 52.23 – 53.00
- 52-week range
- 47.26 – 54.04
5D -0.10 (-0.19%)
Key statistics
- Enterprise value
- 0
- PEG ratio
- 0.00
- Price / sales
- 0.00
- Price / book
- 0.00
- Dividend yield
- 0.00%
- Payout ratio
- 0.00%
- Revenue growth
- 0.00%
- Free cash flow
- 0
- Total cash
- 0
- Total debt
- 0
- Return on equity
- 0.00%
- Short % of float
- 0.00%
- 50-day average
- 50.56
- 200-day average
- 50.87
Next earnings
Consensus EPS estimate 0.00.
About Invesco S&P 500 High Dividend Low Volatility ETF
The fund generally will invest at least 90% of its total assets in the securities that comprise the underlying index. Strictly in accordance with its guidelines and mandated procedures, S&P Dow Jones Indices LLC (the “index Provider”) compiles, maintains and calculates the underlying index, which is designed to measure the performance of 50 least volatile high yielding constituents of the S&P 500 ® Index in the past year.
News
 Retirement Ends the Paycheck. These 3 ETFs Have Sent One Every Month for a Decade
 Here Are 5 ETFs Retirees Use to Collect Monthly Income Without Covered Calls
 Market Turmoil Deepens: ETFs to Consider to Navigate the Volatility
 4 Monthly ETFs That Pay on Different Days, So Your Checks Arrive All Month Long
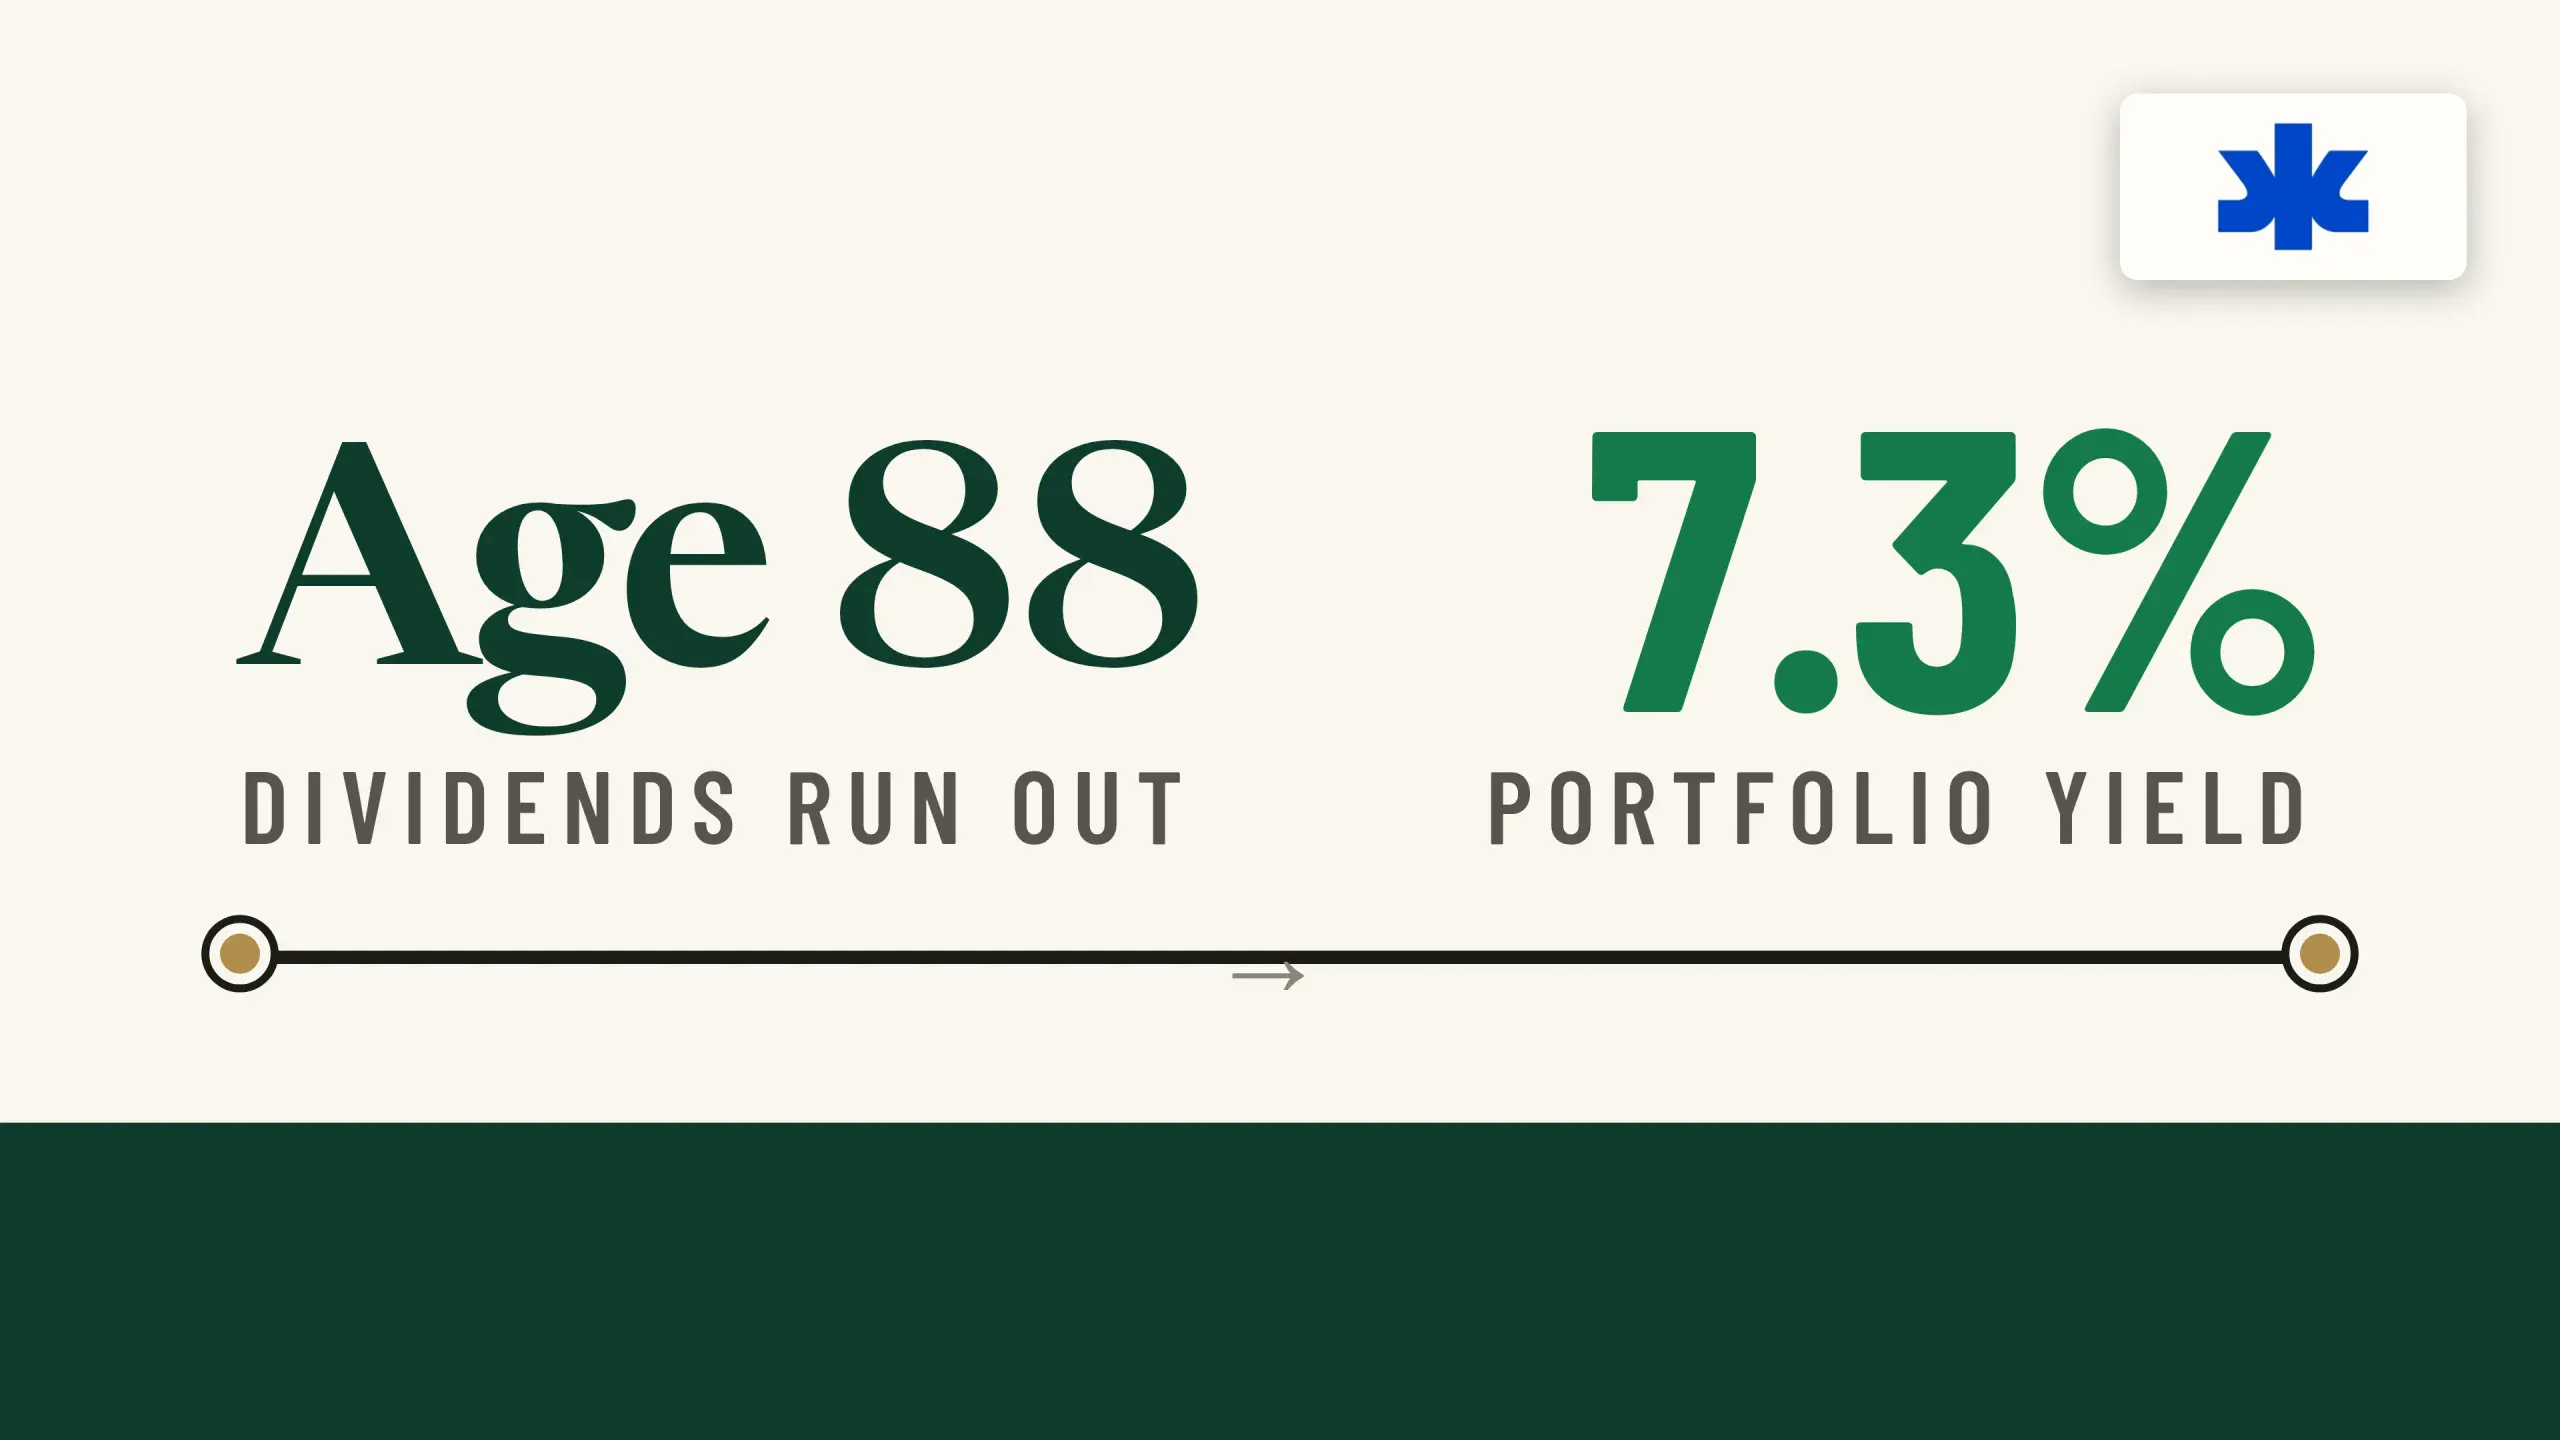 The Dividend Portfolio That Covers Your Required Minimum Distribution Without Selling a Share: KMB, BIZD, and SPHD
 Don't Be Spooked by Rate Risks & Tech Volatility: 3 ETF Tricks for You
 The Performance Chart for Your Dividend ETF Probably Leaves Out the Dividends
 How Large Does Your Portfolio Need to Be to Generate $10,300 a Month?
 SPHD: The ETF I'm Watching For The Ongoing Sector Rotation
 SPHD Holders Left $105,300 on the Table on a $300,000 Position While Chasing Dividends
Your note
Sign in to keep a note on SPHD — it syncs with the Stock Master app.