

Sio Gene Therapies Inc. SIOX
0.48 USD 0.00 (+0.00%)
Feb 7, 2024, 3:58 PM EST
0.38 Day range 0.478
0.25 52-week range 0.50
- EPS (ttm)
- -0.39
- P/E ratio
- -1.23
- Volume
- 7.59K
- Avg volume
- 62.41K
- Open
- 0.38
- Previous close
- 0.478
- Day's range
- 0.38 – 0.478
- 52-week range
- 0.25 – 0.50
- Earnings date
- Jan 4, 2024
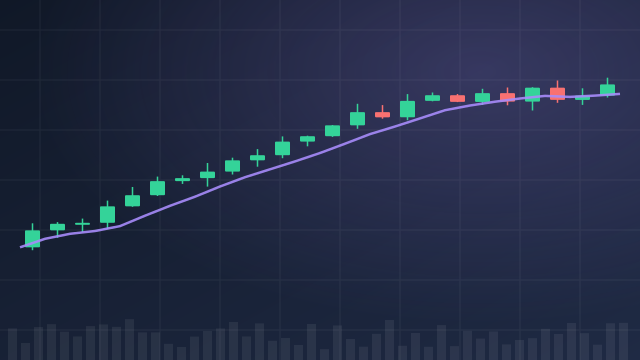
No chart data for this range yet.
Key statistics
- Price / sales
- 0.00
- Dividend yield
- 0.00%
- Payout ratio
- 0.00%
- 50-day average
- 0.00
- 200-day average
- 0.00
Next earnings
Jan 4, 2024
Expected Jan 4, 2024. Consensus EPS estimate 0.00.
Financials — quick view
SIOX Revenue — quarterly 0
SIOX Net income — quarterly -4.02M
SIOX EPS — quarterly -0.05
Earnings
| Report date | Quarter ending | EPS estimate | EPS reported | Surprise | Surprise % |
|---|---|---|---|---|---|
| Jan 4, 2024 | Sep 1, 2023 | 0.00 | — | — | — |
| Oct 5, 2023 | Jun 1, 2023 | 0.00 | — | — | — |
| Feb 14, 2023 | Dec 1, 2022 | 0.00 | -0.05 | — | — |
| Nov 10, 2022 | Sep 1, 2022 | 0.00 | -0.04 | — | — |
News
 Sio Gene Therapies, Inc. to File for Dissolution and Declare an Initial Liquidating Distribution of $0.435 Per Share
 Penny Stocks To Buy Now? 10 Stocks Under $1 To Watch
 3 Hot Penny Stocks To Buy For Under $1 Right Now
 79 Biggest Movers From Yesterday
 24 Stocks Moving in Friday's Pre-Market Session
- Stocks That Hit 52-Week Lows On Wednesday
 74 Biggest Movers From Yesterday
 Stocks That Hit 52-Week Lows On Thursday
- Benzinga's Top Ratings Upgrades, Downgrades For April 28, 2022
 Sio Gene Therapies Ditches Two Remaining Programs, Seeks Buyer(s), Shares Plunge
Your note
Sign in to keep a note on SIOX — it syncs with the Stock Master app.