

Shake Shack Inc. SHAK
69.82 USD -3.00 (-4.12%)
At closeNov 5, 2026, 6:39 PM EST
69.05 -0.77 -1.10%
After hours · Nov 5, 6:39 PM ET
68.21 Day range 76.36
52.34 52-week range 104.69
- YTD
- -13.98%
- 1 year
- -27.07%
- Market cap
- 2.99B
- Revenue (ttm)
- 1.55B
- Profit margin
- 2.56%
- EPS (ttm)
- 1.04
- Shares out
- 40.35M
- P/E ratio
- 67.13
- Forward P/E
- 51.11
- YTD return
- -13.98%
- 1-year return
- -27.07%
- Volume
- 2.03M
- Avg volume
- 1.32M
- Open
- 74.54
- Previous close
- 72.82
- Day's range
- 68.21 – 76.36
- 52-week range
- 52.34 – 104.69
- Beta
- 1.77
- Analysts
- Buy
- Price target
- 80.75 (+15.7%)
- Earnings date
- Feb 25, 2027
YTD -13.65 (-16.35%)
Key statistics
- Enterprise value
- 3.51B
- PEG ratio
- 3.62
- Price / sales
- 2.00
- Price / book
- 5.39
- Dividend yield
- 0.00%
- Payout ratio
- 0.00%
- Revenue growth
- 17.20%
- Free cash flow
- -41.69M
- Total cash
- 307.96M
- Total debt
- 952.09M
- Return on equity
- 7.94%
- Short % of float
- 10.99%
- 50-day average
- 65.10
- 200-day average
- 74.76
Analyst view
Consensus: buy
Buy
Price target (mean) 80.75 +15.7% upside
Now 69.82
- Target (low)
- 34.00
- Target (mean)
- 80.75
- Target (high)
- 126.00
Ratings (0m) 28 15 buy · 12 hold · 1 sell
- Strong buy3
- Buy12
- Hold12
- Sell1
- Strong sell0
Next earnings
Feb 25, 2027
Expected Feb 25, 2027. Consensus EPS estimate 0.3427.
Financials — quick view
SHAK Revenue — quarterly 417.62M
SHAK Net income — quarterly 15.68M
SHAK EPS — quarterly 0.39
Earnings
| Report date | Quarter ending | EPS estimate | EPS reported | Surprise | Surprise % |
|---|---|---|---|---|---|
| Feb 25, 2027 | Dec 30, 2026 | 0.36 | — | — | — |
| Nov 5, 2026 | Sep 30, 2026 | 0.3428 | 0.40 | +0.06 | +16.69% |
| Aug 5, 2026 | Jul 1, 2026 | 0.3055 | 0.43 | +0.12 | +40.75% |
| May 7, 2026 | Apr 1, 2026 | 0.11 | -0.00147 | -0.11 | -101.34% |
| Feb 26, 2026 | Dec 31, 2025 | 0.3492 | 0.37 | +0.02 | +5.96% |
| Oct 30, 2025 | Sep 24, 2025 | 0.3183 | 0.36 | +0.04 | +13.10% |
Upgrades / downgrades
| Date | Firm | Action | From | To |
|---|---|---|---|---|
| Oct 30, 2026 | Mizuho | main | Outperform | Outperform |
| Oct 22, 2026 | UBS | main | Neutral | Neutral |
| Oct 21, 2026 | Wells Fargo | main | Equal-Weight | Equal-Weight |
| Oct 15, 2026 | Morgan Stanley | main | Equal-Weight | Equal-Weight |
| Sep 29, 2026 | JP Morgan | main | Neutral | Neutral |
| Sep 8, 2026 | RBC Capital | init | — | Outperform |
About Shake Shack Inc.
Shake Shack Inc. owns, operates, and licenses Shake Shack restaurants (Shacks) in the United States and internationally. It offers burger, chicken, hot dogs, crinkle cut fries, shakes, frozen custard, beer, wine, and other products. The company was founded in 2001 and is based in New York, New York.
- Sector
- Consumer Cyclical
- Industry
- Restaurants
- Country
- United States
- Website
- shakeshack.com
News
 Shake Shack CEO Warns Lower-Income Americans Are Feeling the Pinch
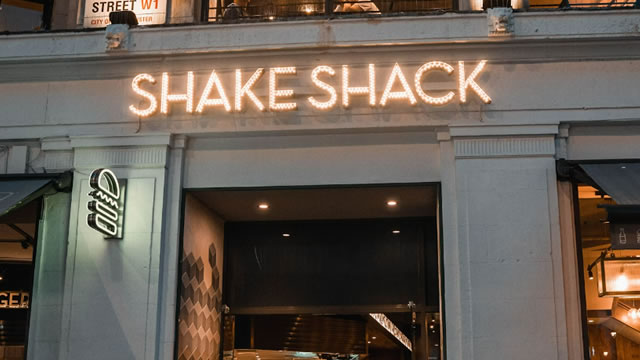 Shake Shack (SHAK) Tops Q3 Earnings Estimates
 Compared to Estimates, Shake Shack (SHAK) Q3 Earnings: A Look at Key Metrics
 Shake Shack Q3 2026 Earnings Call Transcript
 Dow Futures Look to Build on Massive Election Rally
 Wendy's Announces It Unanimously Rejected Unsolicited, Non-Binding Proposal From Trian Consortium; Adopts Limited-Duration Shareholder Rights Plan
 Shake Shack Affirms FY2026 Sales Guidance of $1.600B-$1.700B vs $1.651B Est
 Shake Shack Announces Third Quarter 2026 Financial Results
 SG, SHAK & PZZA: Can These Restaurant Stocks Beat Q3 Estimates?
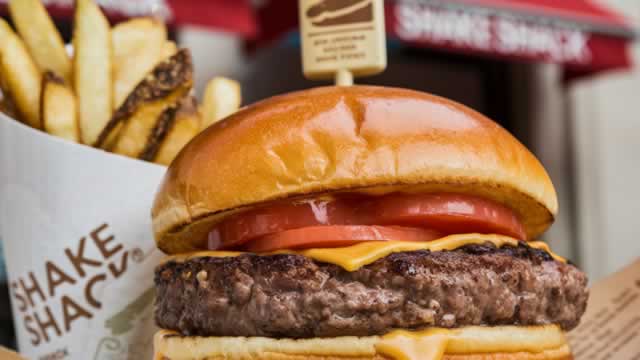 Why Shake Shack Stock Jumped 20% in October
Your note
Sign in to keep a note on SHAK — it syncs with the Stock Master app.
Insider holders
| Insider | Relation | Latest transaction | Date | Shares held |
|---|---|---|---|---|
| BALBALE SUMAIYA | Director | Stock Award(Grant) | Jun 9, 2026 | 17,905 |
| CHAPMAN CHARLES J III | Director | Stock Award(Grant) | Jun 9, 2026 | 10,464 |
| FLUG JEFFREY S | Director and Beneficial Owner of more than 10% of a Class of Security | Stock Award(Grant) | Jun 9, 2026 | 8,361 |
| FOGERTEY KATHERINE IRENE | Chief Financial Officer | Sale | Jul 7, 2025 | 32,495 |
| HOOK MICHELLE GREIG | Chief Financial Officer | Stock Award(Grant) | Jun 14, 2026 | 20,608 |
| LAWRENCE JEFFREY D | Director | Stock Award(Grant) | Jun 9, 2026 | 9,378 |
Institution ownership
| Holder | % held | Shares | Value | Reported |
|---|---|---|---|---|
| Blackrock Inc. | 15.29% | 6,178,269 | 449.04M | Jun 29, 2026 |
| Vanguard Portfolio Management LLC | 5.94% | 2,401,940 | 174.57M | Jun 29, 2026 |
| Vanguard Capital Management LLC | 4.33% | 1,751,672 | 127.31M | Jun 29, 2026 |
| State Street Corporation | 3.89% | 1,570,690 | 114.16M | Jun 29, 2026 |
| Marshall Wace LLP | 3.43% | 1,386,728 | 100.79M | Jun 29, 2026 |
| UBS Group AG | 3.33% | 1,347,542 | 97.94M | Jun 29, 2026 |
Fund ownership
| Holder | % held | Shares | Value | Reported |
|---|---|---|---|---|
| iShares Trust-iShares Core S&P Small-Cap ETF | 5.95% | 2,405,380 | 174.82M | Sep 29, 2026 |
| VANGUARD INDEX FUNDS-Vanguard Total Stock Market Index Fund | 3.02% | 1,219,083 | 88.60M | Jun 29, 2026 |
| iShares Trust-iShares Russell 2000 ETF | 2.53% | 1,022,153 | 74.29M | Sep 29, 2026 |
| VANGUARD INDEX FUNDS-Vanguard Small-Cap Index Fund | 2.17% | 877,914 | 63.81M | Jun 29, 2026 |
| VANGUARD INDEX FUNDS-Vanguard Small-Cap Growth Index Fund | 1.26% | 508,424 | 36.95M | Jun 29, 2026 |
| BARON INVESTMENT Fd.S TRT -Baron Small Cap Fd. | 1.24% | 500,000 | 36.34M | Jun 29, 2026 |