

RadNet, Inc. RDNT
Regular-session close
After hours · Nov 20, 4:41 PM ET
- YTD
- -2.30%
- 1 year
- -12.05%
5D -5.62 (-7.26%)
- Market cap
- 5.49B
- Revenue (ttm)
- 2.38B
- Profit margin
- -0.94%
- EPS (ttm)
- -0.29
- Shares out
- 78.77M
- Forward P/E
- 66.39
- YTD return
- -2.30%
- 1-year return
- -12.05%
- 50-day average
- 72.83
- 200-day average
- 65.44
- Volume
- 594.24K
- Avg volume
- 688.84K
- Open
- 68.28
- Previous close
- 69.51
- Day's range
- 68.00 – 70.86
- 52-week range
- 51.87 – 84.48
- Beta
- 1.40
- Analysts
- Strong Buy
- Price target
- 97.00 (+39.1%)
- Earnings date
- Mar 1, 2027
Key statistics
- Enterprise value
- 7.21B
- PEG ratio
- 0.96
- Price / sales
- 2.30
- Price / book
- 4.90
- Revenue growth
- 22.10%
- Free cash flow
- 165.23M
- Total cash
- 750.61M
- Total debt
- 2.17B
- Return on equity
- 1.78%
- Short % of float
- 13.33%
Fundamental scorecard
4 of 25 checks passed on RDNT’s reported financials
4of 25 checks passed
- Value 1 of 5
- Growth 2 of 5
- Profitability 0 of 5
- Financial health 1 of 5
- Dividend 0 of 5
Statements to Sep 30, 2026.
Analyst view
Consensus: strong buy
- Target (low)
- 83.00
- Target (mean)
- 97.00
- Target (high)
- 108.00
- Strong buy2
- Buy5
- Hold0
- Sell0
- Strong sell0
Next earnings
Mar 1, 2027
Expected Mar 1, 2027. Consensus EPS estimate 0.22143.
Financials — quick view
Earnings
| Report date | Quarter ending | EPS estimate | EPS reported | Surprise | Surprise % |
|---|---|---|---|---|---|
| Mar 1, 2027 | Dec 30, 2026 | 0.28 | — | — | — |
| Nov 8, 2026 | Sep 30, 2026 | 0.2214 | 0.30 | +0.08 | +35.50% |
| Aug 9, 2026 | Jun 30, 2026 | 0.2014 | 0.29 | +0.09 | +43.99% |
| May 11, 2026 | Mar 31, 2026 | -0.14 | -0.28 | -0.14 | -100.00% |
| Mar 2, 2026 | Dec 31, 2025 | 0.19 | 0.23 | +0.04 | +21.05% |
| Nov 10, 2025 | Sep 30, 2025 | 0.2229 | 0.20 | -0.02 | -10.27% |
Upgrades / downgrades
| Date | Firm | Action | From | To |
|---|---|---|---|---|
| Nov 10, 2026 | Keybanc | main | Overweight | Overweight |
| Aug 28, 2026 | Barclays | main | Overweight | Overweight |
| Aug 11, 2026 | Truist Securities | main | Buy | Buy |
| May 20, 2026 | Barclays | main | Overweight | Overweight |
| Apr 21, 2026 | Barclays | main | Overweight | Overweight |
| Jan 9, 2026 | Keybanc | init | — | Overweight |
About RadNet, Inc.
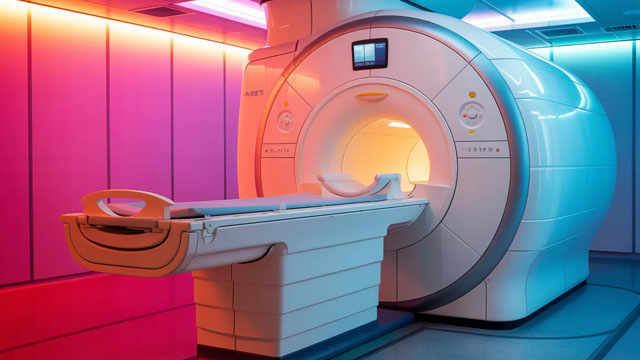
RadNet, Inc., together with its subsidiaries, provides outpatient diagnostic imaging services in the United States and internationally. The company operates in two segments, Imaging Centers and Digital Health. Its services include magnetic resonance imaging, computed tomography, positron emission tomography, nuclear medicine, mammography, ultrasound, diagnostic radiology, fluoroscopy, and other related procedures, as well as multi-modality imaging services. The company also develops and sells computerized systems that distribute, display, store, and retrieve digital images; picture archiving communications systems and related services; and develops and deploys AI suites to enhance radiologist interpretations of breast, lung, and prostate images, as well as solutions for prostate cancer screening. In addition, it develops and delivers AI-powered health informatics solutions to drive quality, efficiency, and outcomes in imaging and radiology; informatics designed for outpatient radiology; and DeepHealth OS, a cloud-native operating system that helps in the operations of the radiology service. RadNet, Inc. was founded in 1981 and is headquartered in Los Angeles, California.
- Sector
- Healthcare
- Industry
- Diagnostics & Research
- Country
- United States
- Website
- radnet.com
News
 DeepHealth to Present Recent Clinical Evidence Demonstrating the Breadth and Impact of Its AI Portfolio at RSNA 2026
 Wall Street Analysts Believe RadNet (RDNT) Could Rally 25.13%: Here's is How to Trade
 Keybanc Maintains Overweight on RadNet, Raises Price Target to $95
 RadNet Q3 2026 Earnings Call Transcript
 Reported Sunday, RadNet Q3 Adj. EPS $0.30 Beats $0.21 Estimate, Sales $638.257M Miss $644.629M Estimate
 KKR, Constellation Energy On Deck Monday As Private Credit, Power Face Test
 RadNet Agrees To Acquire ONRAD For $350M In Cash
Your note
Sign in to keep a note on RDNT — it syncs with the Stock Master app.
Insider holders
| Insider | Relation | Latest transaction | Date | Shares held |
|---|---|---|---|---|
| BERGER HOWARD G FRAN | Chief Executive Officer | Stock Gift | Jun 15, 2026 | 0 |
| FORTHUBER STEPHEN M | Officer | Sale | Jun 14, 2026 | 507,199 |
| HAMES NORMAN R | Officer | Stock Award(Grant) | Mar 2, 2026 | 0 |
| JAYANATHAN RANJAN | Chief Technology Officer | Sale | Aug 18, 2025 | 138,198 |
| KATZ DAVID JEFFREY | Officer | Stock Award(Grant) | Mar 2, 2026 | 90,866 |
| LEVITT LAWRENCE L | Director | Stock Award(Grant) | Jun 1, 2026 | 167,902 |
Institution ownership
| Holder | % held | Shares | Value | Reported |
|---|---|---|---|---|
| Blackrock Inc. | 13.99% | 11,020,792 | 768.26M | Sep 29, 2026 |
| Price (T.Rowe) Associates Inc | 6.27% | 4,941,392 | 344.46M | Sep 29, 2026 |
| RTW Investments LP | 5.88% | 4,630,697 | 322.81M | Sep 29, 2026 |
| Vanguard Portfolio Management LLC | 5.08% | 4,000,816 | 278.90M | Sep 29, 2026 |
| Vanguard Capital Management LLC | 4.06% | 3,194,393 | 222.68M | Sep 29, 2026 |
| Beck, Mack & Oliver LLC | 3.81% | 2,997,752 | 208.97M | Sep 29, 2026 |
Fund ownership
| Holder | % held | Shares | Value | Reported |
|---|---|---|---|---|
| iShares Trust-iShares Core S&P Small-Cap ETF | 4.46% | 3,513,849 | 244.95M | Sep 29, 2026 |
| VANGUARD INDEX FUNDS-Vanguard Total Stock Market Index Fund | 2.86% | 2,252,511 | 157.02M | Jun 29, 2026 |
| iShares Trust-iShares Russell 2000 ETF | 2.35% | 1,850,746 | 129.02M | Sep 29, 2026 |
| T. Rowe Price Mid-Cap Value Fund, Inc. | 2.23% | 1,756,598 | 122.45M | Jun 29, 2026 |
| VANGUARD INDEX FUNDS-Vanguard Small-Cap Index Fund | 2.06% | 1,623,822 | 113.20M | Jun 29, 2026 |
| ETF Series Solutions-Defiance Quantum ETF | 1.45% | 1,143,622 | 79.72M | Jun 29, 2026 |