

Restaurant Brands International Inc. QSR
At closeNov 5, 2026, 5:33 PM EST
After hours · Nov 5, 5:33 PM ET
- YTD
- +15.13%
- 1 year
- +17.19%
- Market cap
- 35.98B
- Revenue (ttm)
- 9.77B
- Profit margin
- 15.35%
- EPS (ttm)
- 4.55
- Shares out
- 348.76M
- P/E ratio
- 17.26
- Forward P/E
- 17.73
- Dividend
- 2.60 (3.50%)
- Ex-dividend date
- Dec 21, 2026
- YTD return
- +15.13%
- 1-year return
- +17.19%
- Volume
- 3.81M
- Avg volume
- 2.95M
- Open
- 78.89
- Previous close
- 78.38
- Day's range
- 77.55 – 78.90
- 52-week range
- 65.43 – 81.96
- Beta
- 0.59
- Analysts
- Buy
- Price target
- 85.32 (+8.6%)
- Earnings date
- Feb 11, 2027
5D +4.54 (+6.13%)
Key statistics
- Enterprise value
- 42.14B
- PEG ratio
- 1.15
- Price / sales
- 3.67
- Price / book
- 6.94
- Dividend yield
- 3.50%
- Payout ratio
- 56.48%
- Revenue growth
- 3.10%
- Free cash flow
- 1.59B
- Total cash
- 1.01B
- Total debt
- 15.67B
- Return on equity
- 39.05%
- Short % of float
- 5.69%
- 50-day average
- 74.33
- 200-day average
- 74.08
Analyst view
Consensus: buy
- Target (low)
- 76.00
- Target (mean)
- 85.32
- Target (high)
- 104.00
- Strong buy2
- Buy15
- Hold10
- Sell0
- Strong sell1
Next earnings
Feb 11, 2027
Expected Feb 11, 2027. Consensus EPS estimate 1.03.
Financials — quick view
Earnings
| Report date | Quarter ending | EPS estimate | EPS reported | Surprise | Surprise % |
|---|---|---|---|---|---|
| Feb 11, 2027 | Dec 30, 2026 | 1.02 | — | — | — |
| Oct 29, 2026 | Sep 30, 2026 | 1.08 | 1.10 | +0.02 | +1.85% |
| Aug 6, 2026 | Jun 30, 2026 | 1.04 | 1.07 | +0.03 | +2.88% |
| May 6, 2026 | Mar 31, 2026 | 0.828 | 0.86 | +0.03 | +3.86% |
| Feb 12, 2026 | Dec 31, 2025 | 0.947 | 0.96 | +0.01 | +1.37% |
| Oct 30, 2025 | Sep 30, 2025 | 0.998 | 1.03 | +0.03 | +3.21% |
Upgrades / downgrades
| Date | Firm | Action | From | To |
|---|---|---|---|---|
| Oct 29, 2026 | TD Cowen | reit | Hold | Hold |
| Oct 20, 2026 | Citigroup | main | Neutral | Neutral |
| Oct 20, 2026 | Mizuho | init | — | Outperform |
| Oct 15, 2026 | Morgan Stanley | main | Equal-Weight | Equal-Weight |
| Oct 7, 2026 | TD Cowen | main | Hold | Hold |
| Sep 29, 2026 | JP Morgan | main | Overweight | Overweight |
About Restaurant Brands International Inc.
Restaurant Brands International Inc. operates as a quick service restaurant company in Canada, the United States, and internationally. It operates through six segments: Tim Hortons, Burger King, Popeyes Louisiana Kitchen, Firehouse Subs, International, and Restaurant Holdings. The company owns and franchises Tim Hortons, a coffee and baked good restaurant chain that offers beverages, sandwiches, wraps, flatbread pizzas, and others; Burger King, a quick service hamburger restaurant chain that offers flame-grilled hamburgers, chicken, and other sandwiches; Popeyes, a quick service chicken concept that offers a Louisiana style menu, including fried bone-in chicken, chicken sandwiches, chicken tenders, wings, fried shrimp, and regional items; and Firehouse Subs, which offers subs with meats and cheese, as well as chili, soups, soft drinks, and other sides. Restaurant Brands International Inc. was founded in 1954 and is headquartered in Miami, Florida.
- Sector
- Consumer Cyclical
- Industry
- Restaurants
- Country
- United States
- Website
- rbi.com
News
 Higher Margins, Better ROIC And Capable Management Define Pershing Square's Q3 2026 Portfolio
 Happy Belly Food Group's Heal Wellness QSR Secures Real Estate Location for Multi-Unit Franchisee in Windsor, Ontario
 Critical Survey: Red Rock Resorts (NASDAQ:RRR) vs. Restaurant Brands International (NYSE:QSR)
 Restaurant Brands International: Burger King Continues To Sizzle, But Popeyes Has Me Worried
 What Restaurant Brands International (QSR) Said on Its Q3 Earnings Call
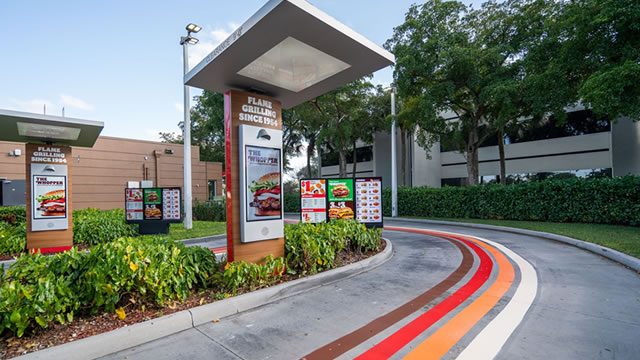 Popeyes' parent company blames ‘complicated' chicken wings for mixed third-quarter results — customers lament fewer options
 Restaurant Brands: A Zombie Stock, But Burger King Shines
 Restaurant Brands International Inc. (QSR) Q3 2026 Earnings Call Transcript
 Restaurant Brands (QSR) Q3 Earnings: How Key Metrics Compare to Wall Street Estimates
 Restaurant Brands International Profit, Revenue Rise on U.S. Burger King Sales
Your note
Sign in to keep a note on QSR — it syncs with the Stock Master app.
Insider holders
| Insider | Relation | Latest transaction | Date | Shares held |
|---|---|---|---|---|
| BEHRING ALEXANDRE C. | Director | Stock Award(Grant) | Dec 30, 2025 | 282,688 |
| DOYLE JOSEPH PATRICK | Officer and Director | Sale | Nov 20, 2025 | 693,855 |
| FRIESNER JACQUELINE | Officer | Sale | Mar 15, 2026 | 165,727 |
| GRANAT JILL M | General Counsel | Sale | Mar 17, 2026 | 478,845 |
| HOUSMAN JEFFREY | Officer | Sale | Mar 19, 2026 | 162,077 |
| KOBZA JOSHUA | Chief Executive Officer | Sale | Mar 17, 2026 | 960,769 |
Institution ownership
| Holder | % held | Shares | Value | Reported |
|---|---|---|---|---|
| Capital World Investors | 12.58% | 43,862,952 | 3.44B | Jun 29, 2026 |
| Pershing Square Inc | 7.41% | 25,821,284 | 2.02B | Jun 29, 2026 |
| Royal Bank of Canada | 5.81% | 20,236,317 | 1.59B | Jun 29, 2026 |
| Edgepoint Investment Group Inc. | 4.93% | 17,171,552 | 1.35B | Jun 29, 2026 |
| Blackrock Inc. | 4.37% | 15,228,770 | 1.19B | Jun 29, 2026 |
| Bank of Montreal /CAN/ | 3.24% | 11,295,632 | 885.41M | Jun 29, 2026 |
Fund ownership
| Holder | % held | Shares | Value | Reported |
|---|---|---|---|---|
| NEW PERSPECTIVE FUND | 3.23% | 11,269,954 | 883.40M | Sep 29, 2026 |
| AMERICAN FUNDS FUNDAMENTAL INVESTORS | 2.90% | 10,109,955 | 792.47M | Sep 29, 2026 |
| Income Fund of America | 2.26% | 7,884,217 | 618.00M | Sep 29, 2026 |
| AMERICAN BALANCED FUND | 1.99% | 6,931,158 | 543.30M | Sep 29, 2026 |
| VANGUARD STAR FUNDS-Vanguard Total International Stock Index Fund | 1.45% | 5,038,777 | 394.96M | Jul 30, 2026 |
| BLACKROCK EQUITY DIVIDEND FUND | 1.02% | 3,555,202 | 278.67M | Jul 30, 2026 |