

Ovintiv Inc. OVV
At closeNov 6, 2026, 5:16 PM EST
After hours · Nov 6, 5:16 PM ET
- YTD
- +54.43%
- 1 year
- +61.13%
- Market cap
- 16.26B
- Revenue (ttm)
- 10.06B
- Profit margin
- 13.13%
- EPS (ttm)
- 5.01
- Shares out
- 268.71M
- P/E ratio
- 12.08
- Forward P/E
- 6.91
- Dividend
- 1.20 (1.97%)
- Ex-dividend date
- Dec 14, 2026
- YTD return
- +54.43%
- 1-year return
- +61.13%
- Volume
- 3.83M
- Avg volume
- 3.35M
- Open
- 60.52
- Previous close
- 60.91
- Day's range
- 60.48 – 62.27
- 52-week range
- 36.98 – 72.62
- Beta
- 0.56
- Analysts
- Buy
- Price target
- 81.48 (+34.6%)
- Earnings date
- Feb 22, 2027
3M +1.16 (+1.95%)
Key statistics
- Enterprise value
- 21.26B
- PEG ratio
- 2.74
- Price / sales
- 1.62
- Price / book
- 1.41
- Dividend yield
- 1.97%
- Payout ratio
- 23.95%
- Revenue growth
- 26.60%
- Free cash flow
- 901.50M
- Total cash
- 176.00M
- Total debt
- 5.07B
- Return on equity
- 12.10%
- Short % of float
- 5.26%
- 50-day average
- 64.92
- 200-day average
- 58.14
Analyst view
Consensus: buy
- Target (low)
- 65.00
- Target (mean)
- 81.48
- Target (high)
- 97.00
- Strong buy5
- Buy16
- Hold4
- Sell0
- Strong sell0
Next earnings
Feb 22, 2027
Expected Feb 22, 2027. Consensus EPS estimate 2.20.
Financials — quick view
Earnings
| Report date | Quarter ending | EPS estimate | EPS reported | Surprise | Surprise % |
|---|---|---|---|---|---|
| Feb 22, 2027 | Dec 30, 2026 | 2.31 | — | — | — |
| Nov 3, 2026 | Sep 30, 2026 | 2.03 | 1.99 | -0.04 | -1.97% |
| Jul 23, 2026 | Jun 30, 2026 | 1.94 | 1.74 | -0.20 | -10.31% |
| May 11, 2026 | Mar 31, 2026 | 1.89 | 1.90 | +0.01 | +0.53% |
| Feb 23, 2026 | Dec 31, 2025 | 1.01 | 1.39 | +0.38 | +37.62% |
| Nov 4, 2025 | Sep 30, 2025 | 0.948 | 1.03 | +0.08 | +8.65% |
Upgrades / downgrades
| Date | Firm | Action | From | To |
|---|---|---|---|---|
| Nov 5, 2026 | Truist Securities | main | Buy | Buy |
| Nov 5, 2026 | Wells Fargo | main | Overweight | Overweight |
| Nov 4, 2026 | Barclays | main | Overweight | Overweight |
| Nov 4, 2026 | Evercore ISI Group | main | Outperform | Outperform |
| Oct 27, 2026 | Stephens & Co. | main | Equal-Weight | Equal-Weight |
| Oct 27, 2026 | Goldman Sachs | main | Buy | Buy |
About Ovintiv Inc.
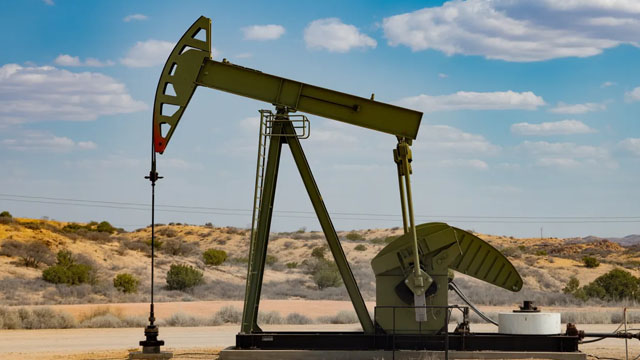
Ovintiv Inc., together with its subsidiaries, operates as an oil and natural gas exploration and production company in North America. The company operates through USA Operations and Canadian Operations segments. It is involved in the exploration, development, production, and marketing of oil, NGLs, natural gas and other related activities in the Permian in West Texas and Anadarko in West-central Oklahoma in the United States, as well as in the Montney in northwest Alberta and northeast British Columbia. The company was formerly known as Encana Corporation and changed its name to Ovintiv Inc. in January 2020. Ovintiv Inc. was incorporated in 2020 and is based in Denver, Colorado.
- Sector
- Energy
- Industry
- Oil & Gas E&P
- Country
- United States
- Website
- ovintiv.com
News
 Truist Securities Maintains Buy on Ovintiv, Raises Price Target to $90
- Wells Fargo Maintains Overweight on Ovintiv, Lowers Price Target to $81
 Ovintiv Inc. (OVV) Q3 2026 Earnings Call Transcript
 Barclays Maintains Overweight on Ovintiv, Raises Price Target to $80
- Evercore ISI Group Maintains Outperform on Ovintiv, Raises Price Target to $77
 Ovintiv (OVV) Q3 Earnings: Taking a Look at Key Metrics Versus Estimates
 Ovintiv (OVV) Lags Q3 Earnings Estimates
 Ovintiv Q3 Adj. EPS $1.95 Misses $1.99 Estimate, Sales $2.602B Beat $2.393B Estimate
 Ovintiv Reports Third Quarter 2026 Financial and Operating Results
 AMD, Shopify On Deck Tuesday As AI Spending, Merchant Growth Face Test
Your note
Sign in to keep a note on OVV — it syncs with the Stock Master app.
Insider holders
| Insider | Relation | Latest transaction | Date | Shares held |
|---|---|---|---|---|
| CODE COREY DOUGLAS | Chief Financial Officer | Conversion of Exercise of derivative security | Mar 9, 2026 | 161,546 |
| DEA PETER A | Director | Conversion of Exercise of derivative security | May 15, 2025 | 83,758 |
| EILERS MEGHAN NICOLE | General Counsel | Sale | Mar 12, 2026 | 54,092 |
| GIVENS GREGORY DEAN | Chief Operating Officer | Conversion of Exercise of derivative security | Mar 9, 2026 | 133,079 |
| MAYSON HOWARD JOHN | Director | Conversion of Exercise of derivative security | May 20, 2026 | 49,290 |
| MCCRACKEN BRENDAN MICHAEL | Chief Executive Officer | Conversion of Exercise of derivative security | Aug 10, 2026 | 297,192 |
Institution ownership
| Holder | % held | Shares | Value | Reported |
|---|---|---|---|---|
| Blackrock Inc. | 10.06% | 27,026,767 | 1.64B | Jun 29, 2026 |
| FMR, LLC | 9.58% | 25,750,709 | 1.56B | Jun 29, 2026 |
| Capital Research Global Investors | 7.24% | 19,445,689 | 1.18B | Jun 29, 2026 |
| Vanguard Portfolio Management LLC | 5.38% | 14,459,194 | 874.93M | Jun 29, 2026 |
| Vanguard Capital Management LLC | 4.70% | 12,630,606 | 764.28M | Jun 29, 2026 |
| Dimensional Fund Advisors LP | 3.89% | 10,449,587 | 632.30M | Sep 29, 2026 |
Fund ownership
| Holder | % held | Shares | Value | Reported |
|---|---|---|---|---|
| iShares Trust-iShares Core S&P Mid-Cap ETF | 3.65% | 9,813,529 | 593.82M | Sep 29, 2026 |
| VANGUARD INDEX FUNDS-Vanguard Total Stock Market Index Fund | 3.32% | 8,919,444 | 539.72M | Jun 29, 2026 |
| VANGUARD INDEX FUNDS-Vanguard Small-Cap Index Fund | 2.40% | 6,441,397 | 389.77M | Jun 29, 2026 |
| VANGUARD WINDSOR FUNDS-Vanguard Windsor II Fund | 1.74% | 4,662,510 | 282.13M | Jul 30, 2026 |
| Fidelity Rutland Square TRT II-Strategic Advisers Fidelity U.S. Total | 1.73% | 4,659,491 | 281.95M | Sep 29, 2026 |
| Growth Fund of America | 1.54% | 4,126,697 | 249.71M | Sep 29, 2026 |