

Omega Healthcare Investors, Inc. OHI
As ofNov 17, 2026, 9:50 AM EST
- YTD
- +5.82%
- 1 year
- +6.20%
- Market cap
- 14.92B
- Revenue (ttm)
- 1.26B
- Profit margin
- 60.48%
- EPS (ttm)
- 2.47
- Shares out
- 304.33M
- P/E ratio
- 18.98
- Forward P/E
- 22.66
- Dividend
- 2.72 (5.78%)
- Ex-dividend date
- Nov 5, 2026
- YTD return
- +5.82%
- 1-year return
- +6.20%
- Volume
- 60.29K
- Avg volume
- 2.00M
- Open
- 46.68
- Previous close
- 47.08
- Day's range
- 46.54 – 47.08
- 52-week range
- 42.18 – 52.39
- Beta
- 0.55
- Analysts
- Buy
- Price target
- 51.95 (+10.7%)
- Earnings date
- Feb 3, 2027
- 50-day average
- 46.42
5D -1.65 (-3.39%)
Key statistics
- 200-day average
- 46.81
- Enterprise value
- 18.41B
- PEG ratio
- 11.99
- Price / sales
- 11.89
- Price / book
- 2.60
- Payout ratio
- 108.91%
- Revenue growth
- -0.60%
- Free cash flow
- 770.33M
- Total cash
- 195.90M
- Total debt
- 4.03B
- Return on equity
- 14.48%
- Short % of float
- 4.86%
Fundamental scorecard
13 of 25 checks passed on OHI’s reported financials
13of 25 checks passed
- Value 2 of 5
- Growth 4 of 5
- Profitability 3 of 5
- Financial health 1 of 5
- Dividend 3 of 5
Statements to Sep 30, 2026.
Analyst view
Consensus: buy
- Target (low)
- 46.00
- Target (mean)
- 51.95
- Target (high)
- 60.00
- Strong buy3
- Buy6
- Hold9
- Sell0
- Strong sell2
Next earnings
Feb 3, 2027
Expected Feb 3, 2027. Consensus EPS estimate 0.52.
Financials — quick view
Earnings
| Report date | Quarter ending | EPS estimate | EPS reported | Surprise | Surprise % |
|---|---|---|---|---|---|
| Feb 3, 2027 | Dec 30, 2026 | 0.512 | — | — | — |
| Nov 3, 2026 | Sep 30, 2026 | 0.4699 | 0.27 | -0.20 | -42.54% |
| Jul 29, 2026 | Jun 30, 2026 | 0.509 | 1.19 | +0.68 | +133.79% |
| Apr 28, 2026 | Mar 31, 2026 | 0.4846 | 0.47 | -0.01 | -3.01% |
| Feb 4, 2026 | Dec 31, 2025 | 0.4952 | 0.55 | +0.05 | +11.07% |
| Oct 30, 2025 | Sep 30, 2025 | 0.4619 | 0.63 | +0.17 | +36.39% |
Upgrades / downgrades
| Date | Firm | Action | From | To |
|---|---|---|---|---|
| Nov 16, 2026 | Mizuho | main | Neutral | Neutral |
| Nov 16, 2026 | RBC Capital | main | Sector Perform | Sector Perform |
| Nov 16, 2026 | Wells Fargo | main | Equal-Weight | Equal-Weight |
| Nov 11, 2026 | UBS | main | Buy | Buy |
| Oct 22, 2026 | Citizens | up | Market Perform | Market Outperform |
| Oct 19, 2026 | Wells Fargo | main | Equal-Weight | Equal-Weight |
About Omega Healthcare Investors, Inc.
Omega Healthcare Investors, Inc. is a real estate investment trust that invests in the long-term healthcare industry, primarily in skilled nursing and assisted living facilities. Its portfolio of assets is operated by a diverse group of healthcare companies, predominantly in a triple-net lease structure. The assets span all regions within the US, as well as in the UK and Canada. Omega Healthcare Investors, Inc. is based in Hunt Valley, United States. The firm is incorporated in Maryland.
- Sector
- Real Estate
- Industry
- REIT - Healthcare Facilities
- Country
- United States
- Website
- omegahealthcare.com
News
 Mizuho Maintains Neutral on Omega Healthcare Invts, Raises Price Target to $49
 RBC Capital Maintains Sector Perform on Omega Healthcare Invts, Raises Price Target to $52
 Wells Fargo Maintains Equal-Weight on Omega Healthcare Invts, Raises Price Target to $49
 PEB or OHI: Which Is the Better Value Stock Right Now?
 How to Use the Years Between 62 and 75 to Turn a $1.05 Million IRA Into $5,100 a Month Tax-Free
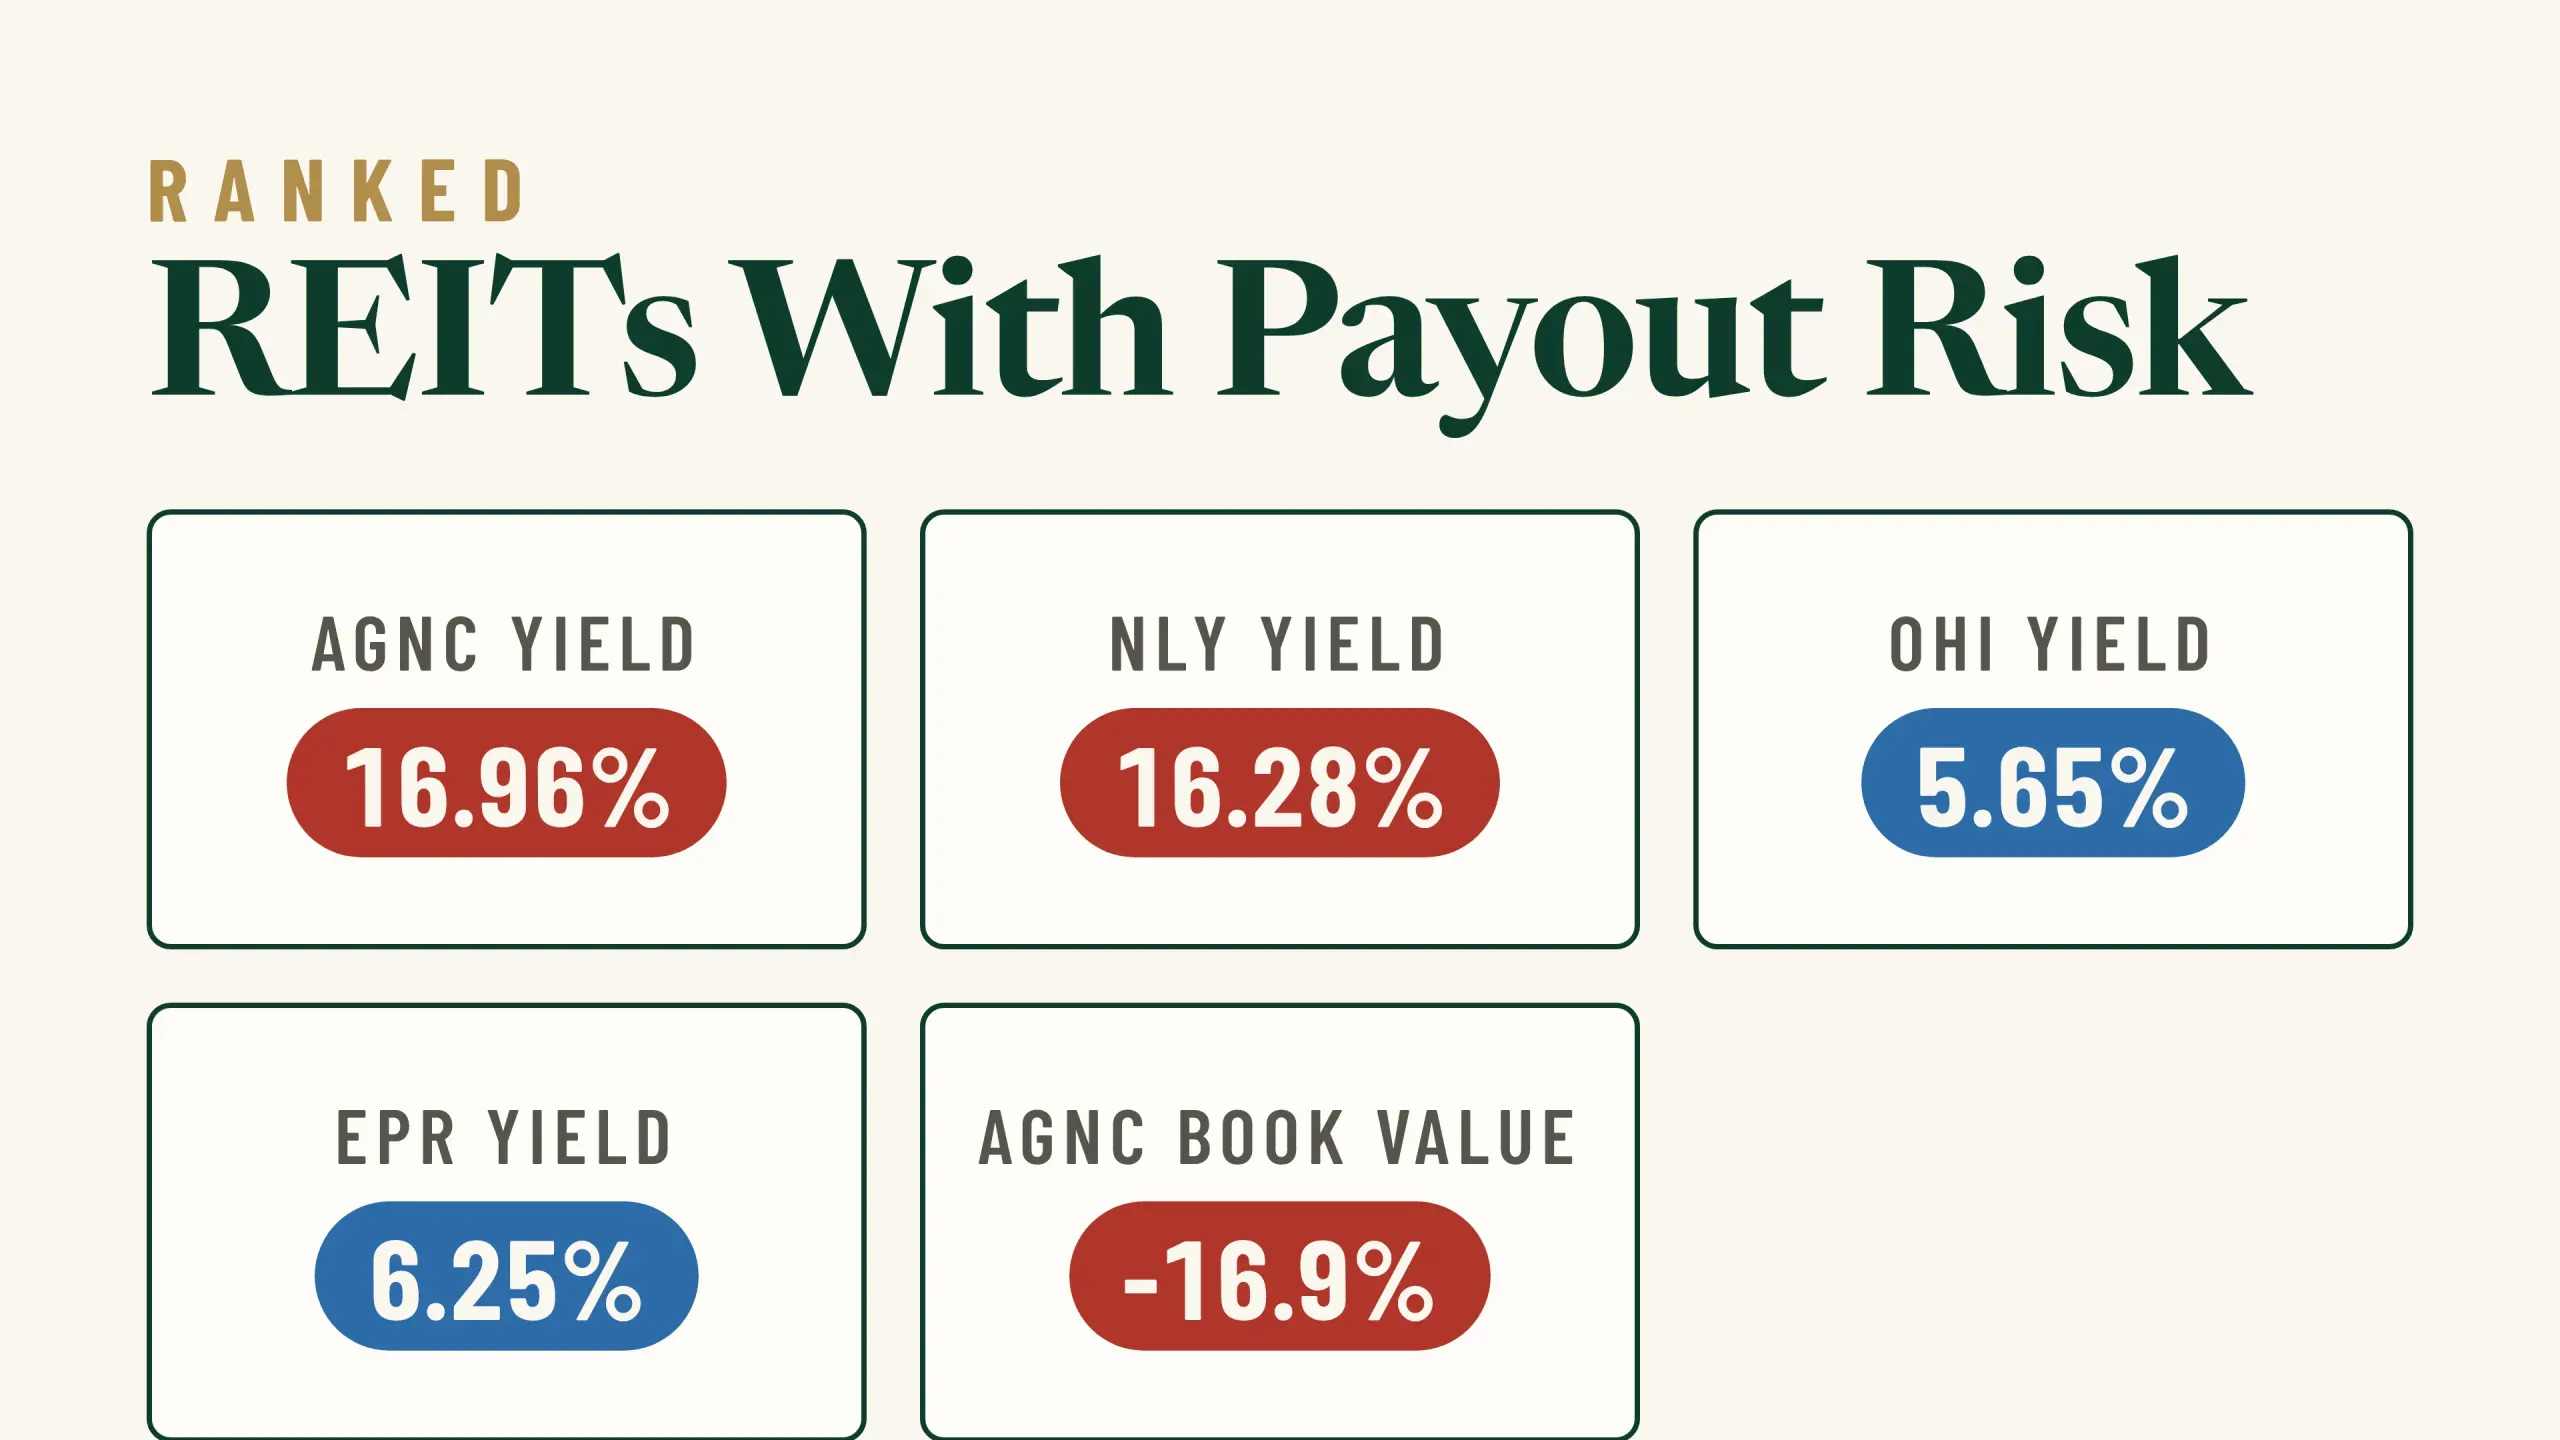 4 REIT Dividend Traps Where Payouts Could Be in Danger
 UBS Maintains Buy on Omega Healthcare Invts, Raises Price Target to $56
 How Much Passive Income $50,000 Generates in These 4 High Yield REITs
 Omega Healthcare Investors: Record-Low Leverage Unlocks Significant Accretion Potential (Upgrade)
 5 High Yield REITs That Pay You Tax Free Inside a Roth
Your note
Sign in to keep a note on OHI — it syncs with the Stock Master app.
Insider holders
| Insider | Relation | Latest transaction | Date | Shares held |
|---|---|---|---|---|
| BALLEW NEAL A. | Officer | Stock Award(Grant) | Jun 30, 2026 | 4,665 |
| EGBUONU-DAVIS LISA | Director | Stock Gift | Aug 6, 2026 | 17,301 |
| GOURMAND MATTHEW PAUL | President | Conversion of Exercise of derivative security | Jun 29, 2026 | 0 |
| GUPTA VIKAS | Chief Investment Officer | Conversion of Exercise of derivative security | Jun 29, 2026 | 0 |
| JACOBS KEVIN J | Director | Stock Award(Grant) | Jun 4, 2026 | 46,935 |
| MAKODE GAIL D | Officer | Conversion of Exercise of derivative security | Mar 30, 2026 | 0 |
Institution ownership
| Holder | % held | Shares | Value | Reported |
|---|---|---|---|---|
| Blackrock Inc. | 12.96% | 39,437,580 | 1.86B | Sep 29, 2026 |
| Vanguard Portfolio Management LLC | 8.84% | 26,905,858 | 1.27B | Sep 29, 2026 |
| Cohen & Steers Inc. | 7.54% | 22,936,053 | 1.08B | Jun 29, 2026 |
| State Street Corporation | 4.92% | 14,968,115 | 704.70M | Sep 29, 2026 |
| Vanguard Capital Management LLC | 4.47% | 13,602,298 | 640.40M | Sep 29, 2026 |
| Geode Capital Management, LLC | 3.03% | 9,232,782 | 434.68M | Sep 29, 2026 |
Fund ownership
| Holder | % held | Shares | Value | Reported |
|---|---|---|---|---|
| VANGUARD SPECIALIZED FUNDS-Vanguard Real Estate Index Fund | 3.69% | 11,243,708 | 529.35M | Jul 30, 2026 |
| iShares Trust-iShares Core S&P Mid-Cap ETF | 3.55% | 10,793,410 | 508.15M | Sep 29, 2026 |
| VANGUARD INDEX FUNDS-Vanguard Total Stock Market Index Fund | 3.11% | 9,459,743 | 445.36M | Jun 29, 2026 |
| VANGUARD INDEX FUNDS-Vanguard Small-Cap Index Fund | 2.24% | 6,828,513 | 321.49M | Jun 29, 2026 |
| VANGUARD INDEX FUNDS-Vanguard Small-Cap Value Index Fund | 1.42% | 4,326,395 | 203.69M | Jun 29, 2026 |
| COHEN & STEERS Inst. REALTY SHARES INC-Cohen & Steers Inst. Realty Sha | 1.32% | 4,021,228 | 189.32M | Jun 29, 2026 |