

Northern Oil and Gas, Inc. NOG
24.32 USD +0.91 (+3.89%)
At closeNov 11, 2026, 4:02 PM EST
24.32 0.00 0.00%
After hours · Nov 11, 4:02 PM ET
23.33 Day range 24.32
17.18 52-week range 31.17
- YTD
- +13.27%
- 1 year
- +7.33%
- Market cap
- 2.58B
- Revenue (ttm)
- 2.21B
- Profit margin
- -21.19%
- EPS (ttm)
- -4.57
- Shares out
- 105.90M
- Forward P/E
- 4.81
- Dividend
- 1.80 (7.69%)
- Ex-dividend date
- Dec 29, 2026
- YTD return
- +13.27%
- 1-year return
- +7.33%
- Volume
- 1.64M
- Avg volume
- 2.09M
- Open
- 23.60
- Previous close
- 23.41
- Day's range
- 23.33 – 24.32
- 52-week range
- 17.18 – 31.17
- Beta
- 0.85
- Analysts
- Buy
- Price target
- 30.33 (+24.7%)
- Earnings date
- Feb 24, 2027
5D +1.49 (+6.65%)
Key statistics
- Enterprise value
- 5.06B
- PEG ratio
- 7.35
- Price / sales
- 1.16
- Price / book
- 1.41
- Dividend yield
- 7.69%
- Payout ratio
- 461.54%
- Revenue growth
- 43.70%
- Free cash flow
- -361.02M
- Total cash
- 26.42M
- Total debt
- 2.62B
- Return on equity
- -23.05%
- Short % of float
- 22.25%
- 50-day average
- 25.35
- 200-day average
- 24.57
Analyst view
Consensus: buy
Buy
Price target (mean) 30.33 +24.7% upside
Now 24.32
- Target (low)
- 26.00
- Target (mean)
- 30.33
- Target (high)
- 35.00
Ratings (0m) 10 4 buy · 5 hold · 1 sell
- Strong buy1
- Buy3
- Hold5
- Sell1
- Strong sell0
Next earnings
Feb 24, 2027
Expected Feb 24, 2027. Consensus EPS estimate 1.18.
Financials — quick view
NOG Revenue — quarterly 345.90M
NOG Net income — quarterly -111.81M
NOG EPS — quarterly -1.06
Earnings
| Report date | Quarter ending | EPS estimate | EPS reported | Surprise | Surprise % |
|---|---|---|---|---|---|
| Feb 24, 2027 | Dec 30, 2026 | 1.18 | — | — | — |
| Nov 5, 2026 | Sep 30, 2026 | 1.09 | 1.32 | +0.23 | +21.10% |
| Aug 6, 2026 | Jun 30, 2026 | 1.18 | 1.13 | -0.05 | -4.24% |
| Apr 28, 2026 | Mar 31, 2026 | 0.71 | 0.74 | +0.03 | +4.23% |
| Feb 25, 2026 | Dec 31, 2025 | 0.772 | 0.83 | +0.06 | +7.51% |
| Nov 6, 2025 | Sep 30, 2025 | 0.871 | 1.03 | +0.16 | +18.25% |
Upgrades / downgrades
| Date | Firm | Action | From | To |
|---|---|---|---|---|
| Nov 11, 2026 | Citigroup | main | Buy | Buy |
| Oct 15, 2026 | Scotiabank | init | — | Sector Perform |
| Oct 15, 2026 | Citigroup | main | Buy | Buy |
| Oct 15, 2026 | Morgan Stanley | main | Underweight | Underweight |
| Oct 14, 2026 | Mizuho | main | Neutral | Neutral |
| Sep 10, 2026 | Raymond James | main | Outperform | Outperform |
About Northern Oil and Gas, Inc.
Northern Oil and Gas, Inc., an independent energy company, engages in the acquisition, exploration, exploitation, development, and production of crude oil and natural gas properties in the United States. Northern Oil and Gas, Inc. was founded in 2006 and is headquartered in Minnetonka, Minnesota.
- Sector
- Energy
- Industry
- Oil & Gas E&P
- Country
- United States
- Website
- noginc.com
News
 Citigroup Maintains Buy on Northern Oil & Gas, Lowers Price Target to $30
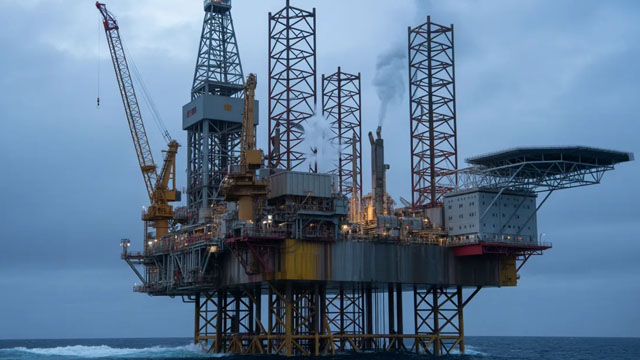 3 Oil Stocks to Buy on the Dip After Crushing Q3 Expectations: CVI, DK, NOG
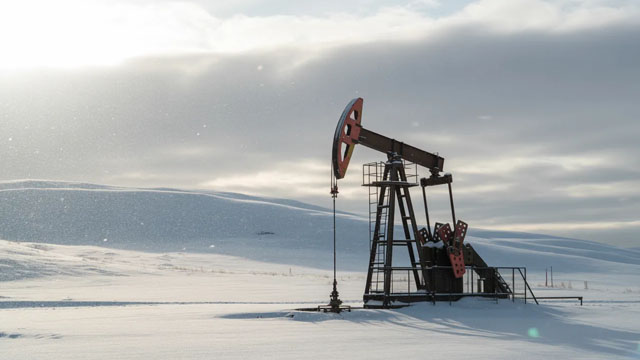 Northern Oil And Gas: Strong Production, But Weak Per-Share Economics
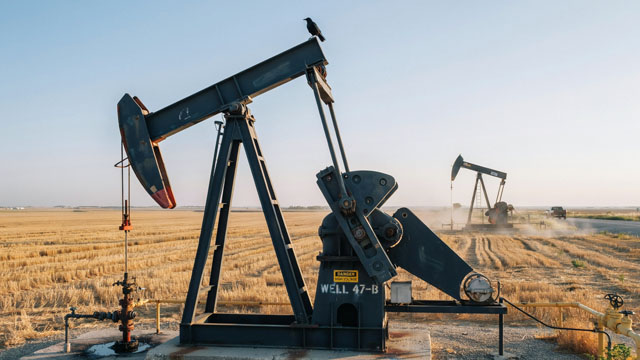 Northern Oil and Gas Q3 Earnings Call Highlights
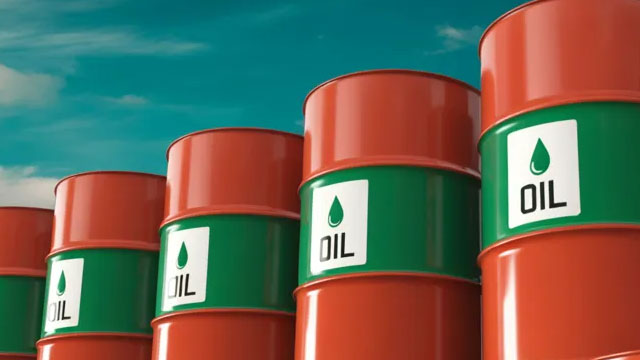 Here's What Key Metrics Tell Us About Northern Oil and Gas (NOG) Q3 Earnings
 Northern Oil and Gas, Inc. (NOG) Q3 2026 Earnings Call Transcript
 Northern Oil & Gas Q3 2026 Earnings Call Transcript
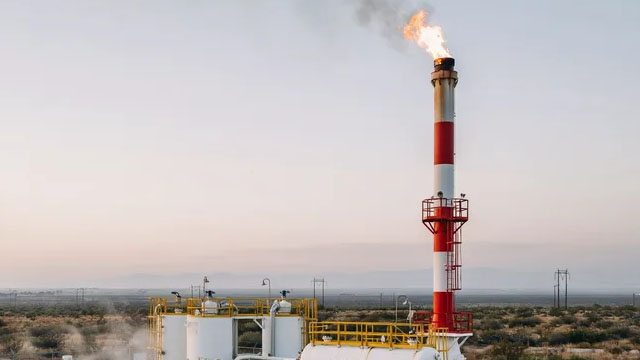 Northern Oil and Gas (NOG) Reports Q3 Earnings: What Key Metrics Have to Say
 Northern Oil & Gas Q3 Adj. EPS $1.32 Beats $1.06 Estimate, Sales $697.693M Beat $601.169M Estimate
 NOG Announces Third Quarter 2026 Results
Your note
Sign in to keep a note on NOG — it syncs with the Stock Master app.
Insider holders
| Insider | Relation | Latest transaction | Date | Shares held |
|---|---|---|---|---|
| AKRADI BAHRAM | Director | Stock Award(Grant) | Sep 29, 2026 | 1,724,810 |
| ALLEN CHAD WILLIAM | Chief Financial Officer | Stock Award(Grant) | Mar 15, 2026 | 83,910 |
| DIRLAM ADAM A | President | Stock Award(Grant) | Mar 15, 2026 | 0 |
| EASLEY ROY ERNEST | Director | Stock Award(Grant) | Mar 30, 2026 | 86,666 |
| EVANS JAMES B | Chief Technology Officer | Stock Award(Grant) | Mar 15, 2026 | 78,179 |
| FRANTZ MICHAEL A | Director | Stock Award(Grant) | Sep 29, 2026 | 69,053 |
Institution ownership
| Holder | % held | Shares | Value | Reported |
|---|---|---|---|---|
| Blackrock Inc. | 15.15% | 16,041,709 | 389.97M | Jun 29, 2026 |
| American Century Companies Inc | 7.99% | 8,457,296 | 205.60M | Jun 29, 2026 |
| State Street Corporation | 6.78% | 7,183,786 | 174.64M | Jun 29, 2026 |
| Vanguard Portfolio Management LLC | 6.48% | 6,858,909 | 166.74M | Jun 29, 2026 |
| Invesco Ltd. | 5.67% | 6,005,719 | 146.00M | Jun 29, 2026 |
| Dimensional Fund Advisors LP | 4.90% | 5,184,295 | 126.03M | Sep 29, 2026 |
Fund ownership
| Holder | % held | Shares | Value | Reported |
|---|---|---|---|---|
| iShares Trust-iShares Core S&P Small-Cap ETF | 5.96% | 6,315,674 | 153.53M | Sep 29, 2026 |
| American Century ETF Trust-Avantis U.S. Small Cap Value ETF | 3.83% | 4,051,110 | 98.48M | Sep 29, 2026 |
| SPDR SERIES TRT-State Street SPDR S&P Oil & Gas Exploration & Producti | 3.07% | 3,253,694 | 79.10M | Sep 29, 2026 |
| VANGUARD INDEX FUNDS-Vanguard Total Stock Market Index Fund | 3.02% | 3,197,401 | 77.73M | Jun 29, 2026 |
| iShares Trust-iShares Russell 2000 ETF | 2.68% | 2,832,945 | 68.87M | Sep 29, 2026 |
| VANGUARD INDEX FUNDS-Vanguard Small-Cap Index Fund | 2.17% | 2,298,616 | 55.88M | Jun 29, 2026 |