

NIKE, Inc. NKE
Nov 3, 2026, 3:44 PM EST
- YTD
- -39.90%
- 1 year
- -38.88%
- Market cap
- 56.86B
- Revenue (ttm)
- 45.89B
- Profit margin
- 6.74%
- EPS (ttm)
- 2.08
- Shares out
- 1.20B
- P/E ratio
- 18.40
- Forward P/E
- 25.12
- Dividend
- 1.64 (4.27%)
- Ex-dividend date
- Aug 31, 2026
- YTD return
- -39.90%
- 1-year return
- -38.88%
- Volume
- 12.41M
- Avg volume
- 33.23M
- Open
- 38.71
- Previous close
- 39.12
- Day's range
- 37.94 – 38.97
- 52-week range
- 33.87 – 67.78
- Beta
- 1.03
- Analysts
- Hold
- Price target
- 36.50 (-4.7%)
- Earnings date
- Dec 17, 2026
5m +1.10 (+2.96%)
Key statistics
- Enterprise value
- 60.19B
- PEG ratio
- 3.35
- Price / sales
- 1.27
- Price / book
- 3.81
- Dividend yield
- 4.24%
- Payout ratio
- 78.85%
- Revenue growth
- -4.30%
- Free cash flow
- 1.77B
- Total cash
- 8.37B
- Total debt
- 11.13B
- Return on equity
- 21.56%
- Short % of float
- 10.85%
- 50-day average
- 36.94
- 200-day average
- 46.05
Analyst view
Consensus: hold
- Target (low)
- 19.00
- Target (mean)
- 36.50
- Target (high)
- 60.00
- Strong buy2
- Buy8
- Hold25
- Sell5
- Strong sell3
Next earnings
Dec 17, 2026
Expected Dec 17, 2026. Consensus EPS estimate 0.3897.
Financials — quick view
Earnings
| Report date | Quarter ending | EPS estimate | EPS reported | Surprise | Surprise % |
|---|---|---|---|---|---|
| Dec 17, 2026 | Nov 30, 2026 | 0.34 | — | — | — |
| Oct 1, 2026 | Aug 31, 2026 | 0.4331 | 0.48 | +0.05 | +10.83% |
| Jun 30, 2026 | May 31, 2026 | 0.11 | 0.72 | +0.61 | +554.55% |
| Mar 31, 2026 | Feb 28, 2026 | 0.2908 | 0.35 | +0.06 | +20.36% |
| Dec 18, 2025 | Nov 30, 2025 | 0.3747 | 0.53 | +0.16 | +41.45% |
| Sep 30, 2025 | Aug 31, 2025 | 0.272 | 0.49 | +0.22 | +80.15% |
Upgrades / downgrades
| Date | Firm | Action | From | To |
|---|---|---|---|---|
| Oct 22, 2026 | Guggenheim | reit | Buy | Buy |
| Oct 22, 2026 | Wolfe Research | init | — | Underperform |
| Oct 22, 2026 | Barclays | main | Overweight | Overweight |
| Oct 22, 2026 | BTIG | reit | Buy | Buy |
| Oct 5, 2026 | Barclays | main | Overweight | Overweight |
| Oct 2, 2026 | Freedom Broker | up | Sell | Buy |
About NIKE, Inc.
NIKE, Inc., together with its subsidiaries, designs, develops, markets, and sells athletic footwear, apparel, equipment, accessories, and services for men, women, and kids in North America, Europe, the Middle East, Africa, Greater China, the Asia Pacific, and Latin America. The company offers its products under the NIKE, Jordan, Converse, Jumpman, Chuck Taylor, All Star, One Star, Star Chevron, and Jack Purcell trademarks. It also provides a line of performance equipment and accessories, including bags, socks, sport balls, eyewear, timepieces, digital devices, bats, gloves, protective equipment, and other equipment for sports activities; and sports apparel, as well as sells products to wholesale customers and directly to consumers through NIKE Direct operations; distributes and licenses casual sneakers, apparel, and accessories; and markets apparel with licensed college and professional team and league logos. In addition, the company offers consumer services and experiences, including sport focused events and activations; fitness and activity apps; sport, fitness, and wellness content; and digital services and features in retail stores. It sells its products to footwear stores; sporting goods stores; athletic specialty stores; department stores; skate, tennis, and golf shops; and other wholesale accounts through NIKE-owned retail stores, independent distributors, licensees, sales representatives, and digital platforms. The company was formerly known as Blue Ribbon Sports, Inc. and changed its name to NIKE, Inc. in May 1971. NIKE, Inc. was founded in 1964 and is headquartered in Beaverton, Oregon.
- Sector
- Consumer Cyclical
- Industry
- Footwear & Accessories
- Country
- United States
- Website
- nike.com
News
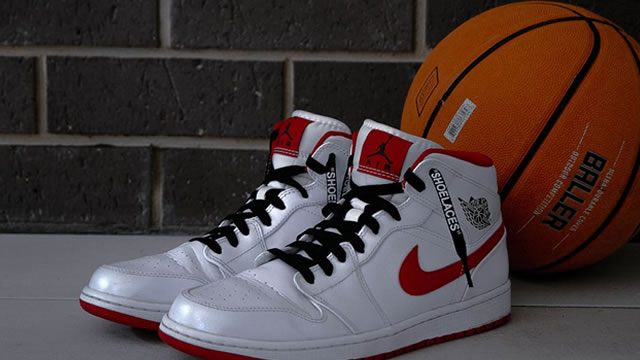 What Would Warren Buffett Do With Nike Stock Down 38% in 2026?
 4 Consumer Discretionary Stocks With Whale Alerts In Today’s Session
 Why I Still Wouldn't Buy Nike Stock in November
 Nike (NKE) Ascends While Market Falls: Some Facts to Note
 CRI or NKE: Which Is the Better Value Stock Right Now?
 1 Stat That Makes Nike Stock Hard to Ignore
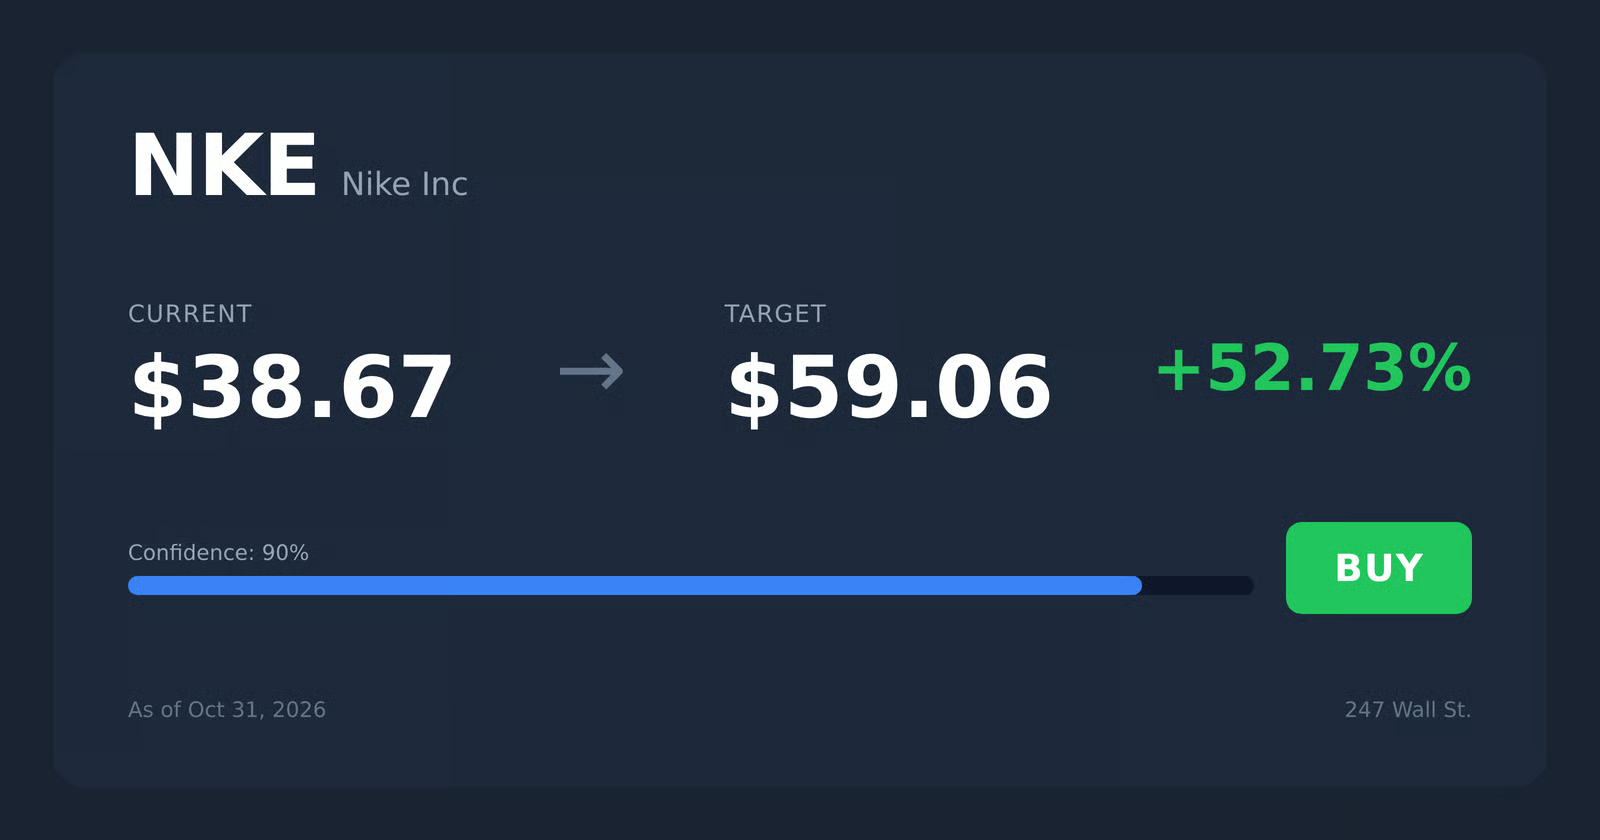 ‘They’ve Shot Themselves in the Face’: Ramsey Blames Kaepernick for Nike’s Collapse, but Nike’s China Revenue Was Down 26%
 NIKE, Inc. $NKE Stock: D.A. Davidson & CO. Grows Position
 $1,000 Invested in Nike 10 Years Ago Is Worth Just $853 Today, Even With Dividends
 Nike deepens India push with new running shoe, seeking fresh growth engines
Your note
Sign in to keep a note on NKE — it syncs with the Stock Master app.
Insider holders
| Insider | Relation | Latest transaction | Date | Shares held |
|---|---|---|---|---|
| ALAGIRISAMY VENKATESH | Chief Operating Officer | Sale | Sep 8, 2026 | 104,862 |
| COOK TIMOTHY D | Director | Stock Award(Grant) | Sep 7, 2026 | 135,527 |
| HEINLE TREASURE | Officer | Stock Award(Grant) | Aug 31, 2026 | 91,415 |
| HILL ELLIOTT | Chief Executive Officer | Stock Award(Grant) | Aug 31, 2026 | 373,730 |
| KNIGHT PHILIP H | Divisional Officer | Stock Gift | Feb 10, 2026 | 12,835,700 |
| KNIGHT TRAVIS A | Director | Stock Award(Grant) | Sep 7, 2026 | 9,538,990 |
Institution ownership
| Holder | % held | Shares | Value | Reported |
|---|---|---|---|---|
| Blackrock Inc. | 6.80% | 81,814,490 | 3.20B | Jun 29, 2026 |
| Vanguard Capital Management LLC | 6.50% | 78,309,610 | 3.06B | Jun 29, 2026 |
| Capital World Investors | 5.99% | 72,055,429 | 2.82B | Jun 29, 2026 |
| State Street Corporation | 5.28% | 63,598,789 | 2.49B | Jun 29, 2026 |
| Vanguard Portfolio Management LLC | 3.80% | 45,777,579 | 1.79B | Jun 29, 2026 |
| Geode Capital Management, LLC | 2.43% | 29,258,503 | 1.14B | Jun 29, 2026 |
Fund ownership
| Holder | % held | Shares | Value | Reported |
|---|---|---|---|---|
| VANGUARD INDEX FUNDS-Vanguard Total Stock Market Index Fund | 3.16% | 38,083,820 | 1.49B | Jun 29, 2026 |
| VANGUARD INDEX FUNDS-Vanguard 500 Index Fund | 2.58% | 31,087,986 | 1.22B | Jun 29, 2026 |
| AMERICAN BALANCED FUND | 1.79% | 21,557,607 | 843.33M | Sep 29, 2026 |
| Growth Fund of America | 1.40% | 16,890,695 | 660.76M | Sep 29, 2026 |
| iShares Trust-iShares Core S&P 500 ETF | 1.33% | 16,006,030 | 626.16M | Sep 29, 2026 |
| Fidelity Concord Street Trust-Fidelity 500 Index Fund | 1.29% | 15,570,563 | 609.12M | Aug 30, 2026 |