

Lucid Group, Inc. LCID
3.14 USD +0.16 (+5.37%)
Nov 6, 2026, 12:51 PM EST
3.03 Day range 3.19
2.37 52-week range 18.00
- YTD
- -70.29%
- 1 year
- -82.52%
- Market cap
- 1.24B
- Revenue (ttm)
- 1.55B
- Profit margin
- -249.21%
- EPS (ttm)
- -13.71
- Shares out
- 394.07M
- Forward P/E
- -0.67
- YTD return
- -70.29%
- 1-year return
- -82.52%
- Volume
- 4.76M
- Avg volume
- 10.93M
- Open
- 3.05
- Previous close
- 2.98
- Day's range
- 3.03 – 3.19
- 52-week range
- 2.37 – 18.00
- Beta
- 0.88
- Price target
- 7.39 (+135.3%)
- Earnings date
- Nov 9, 2026
1D +0.17 (+5.70%)
Key statistics
- Enterprise value
- 6.99B
- PEG ratio
- 0.00
- Price / sales
- 0.86
- Price / book
- 0.00
- Dividend yield
- 0.00%
- Payout ratio
- 0.00%
- Revenue growth
- 56.20%
- Free cash flow
- -3.36B
- Total cash
- 761.31M
- Total debt
- 3.66B
- Return on equity
- -125.99%
- Short % of float
- 60.36%
- 50-day average
- 3.97
- 200-day average
- 6.79
Analyst view
Price target (mean) 7.39 +135.3% upside
Now 3.14
- Target (low)
- 3.00
- Target (mean)
- 7.39
- Target (high)
- 17.00
Ratings (0m) 11 1 buy · 7 hold · 3 sell
- Strong buy0
- Buy1
- Hold7
- Sell1
- Strong sell2
Next earnings
Nov 9, 2026
Expected Nov 9, 2026. Consensus EPS estimate -2.21.
Financials — quick view
LCID Revenue — quarterly 405.35M
LCID Net income — quarterly -1.03B
LCID EPS — quarterly -3.30
Earnings
| Report date | Quarter ending | EPS estimate | EPS reported | Surprise | Surprise % |
|---|---|---|---|---|---|
| Nov 9, 2026 | Sep 30, 2026 | -2.27 | — | — | — |
| Aug 4, 2026 | Jun 30, 2026 | -2.38 | -3.30 | -0.92 | -38.66% |
| May 5, 2026 | Mar 31, 2026 | -2.72 | -3.46 | -0.74 | -27.21% |
| Feb 24, 2026 | Dec 31, 2025 | -2.49 | -3.62 | -1.13 | -45.38% |
| Nov 5, 2025 | Sep 30, 2025 | -2.32 | -3.31 | -0.99 | -42.67% |
| Aug 5, 2025 | Jun 30, 2025 | -2.18 | -2.42 | -0.24 | -11.01% |
Upgrades / downgrades
| Date | Firm | Action | From | To |
|---|---|---|---|---|
| Oct 15, 2026 | Morgan Stanley | main | Underweight | Underweight |
| Oct 12, 2026 | RBC Capital | main | Sector Perform | Sector Perform |
| Aug 19, 2026 | Citigroup | main | Buy | Buy |
| Jul 13, 2026 | RBC Capital | main | Sector Perform | Sector Perform |
| May 15, 2026 | Citigroup | main | Buy | Buy |
| May 6, 2026 | TD Cowen | main | Hold | Hold |
About Lucid Group, Inc.
Lucid Group, Inc., a technology company, designs, develops, manufactures, and sells electric vehicles (EV), EV powertrains, and battery systems. The company provides Lucid Air sedan and Lucid Gravity SUV. It also designs and develops proprietary software in-house for Lucid vehicles. The company sells vehicles directly to consumers through its retail sales network and direct online sales, including Lucid Financial Services. The company is headquartered in Newark, California. Lucid Group, Inc. is a subsidiary of Ayar Third Investment Company.
- Sector
- Consumer Cyclical
- Industry
- Auto Manufacturers
- Country
- United States
- Website
- lucidmotors.com
News
 Lucid Jumps 12%, Rivian Climbs 6% as Post-Election Rally Lifts EV Stocks; Tesla Slides 3%
 The SPAC Sponsor Behind Lucid and Oklo Is Taking Agility Robotics Public on Nov. 5. Here's What Those 2 Stocks Did in Their First 90 Days.
 Rivian Automotive Stock Is Gaining Wednesday: What's Going On?
 Will Lucid Group (LCID) Report Negative Earnings Next Week? What You Should Know
 Why Did Lucid Stock Just Pop?
 Lucid Is Trying to Spend Less. Here's Where It Needs to Spend More.
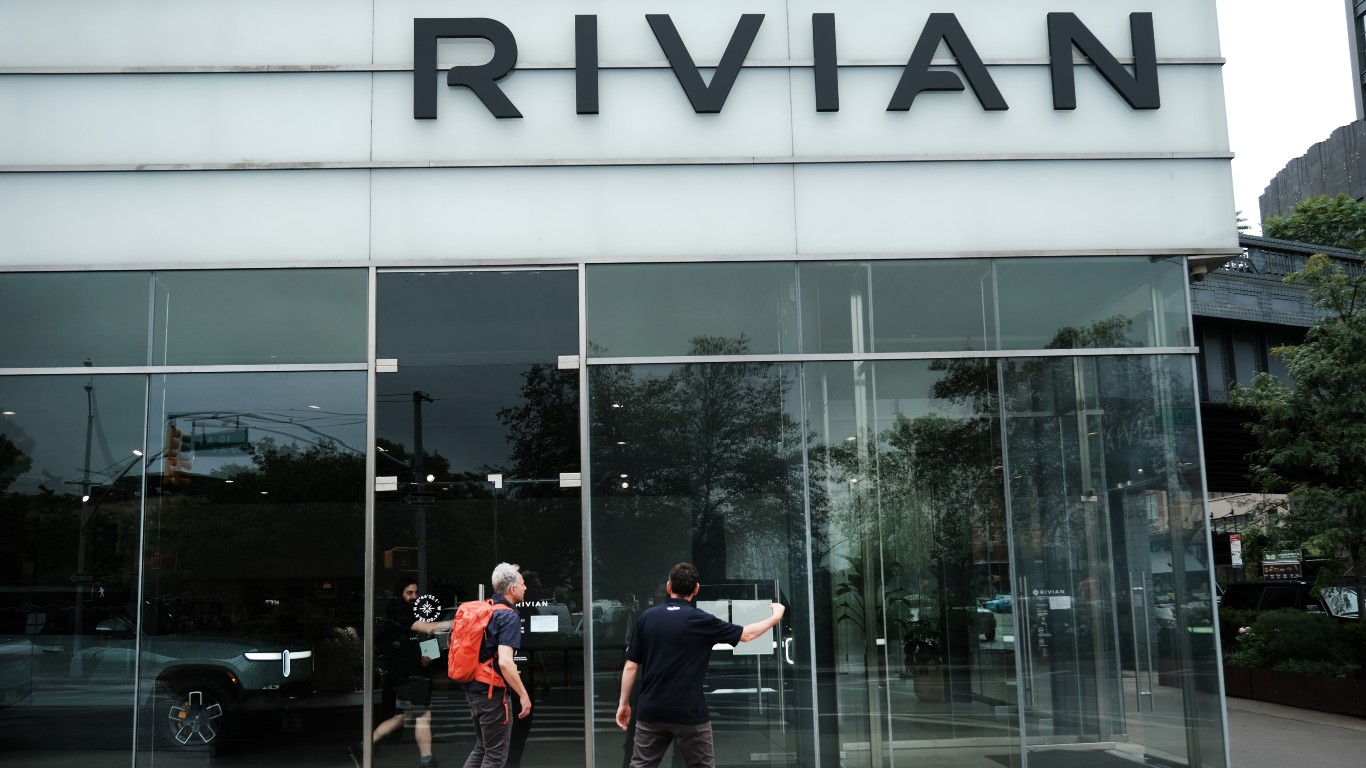 Rivian Earnings Don’t Mask Stock Collapse
 Lucid Is Buying Time. Here's What It Costs Shareholders
 Rivian Gains 3% as R2 Ramp Drives Raised Delivery Outlook; Tesla Falls 3%, Lucid Slides 2%, Ford Eases
 Lucid vs. Ferrari: Which Luxury Car Stock Can Superpower Your Profits 2026?
Your note
Sign in to keep a note on LCID — it syncs with the Stock Master app.
Insider holders
| Insider | Relation | Latest transaction | Date | Shares held |
|---|---|---|---|---|
| ALNOWAISER TURQI A | Director and Beneficial Owner of more than 10% of a Class of Security | Stock Award(Grant) | Jun 3, 2026 | 276,351 |
| BACH ERIC | Officer | Stock Award(Grant) | Jun 16, 2025 | 3,835,650 |
| BOUSSAID TAOUFIQ | Chief Financial Officer | Stock Award(Grant) | Mar 2, 2026 | 126,222 |
| DE BOCK ALEXANDER | Chief Financial Officer | Stock Award(Grant) | Aug 4, 2026 | 501,622 |
| DHINGRA GAGAN | Officer | Stock Award(Grant) | Mar 2, 2026 | 147,853 |
| LAMBERT LISA MARIE | Director | Stock Award(Grant) | Jun 3, 2026 | 71,919 |
Institution ownership
| Holder | % held | Shares | Value | Reported |
|---|---|---|---|---|
| Public Investment Fund | 44.94% | 177,088,867 | 596.79M | Jun 29, 2026 |
| Uber Technologies, Inc | 9.58% | 37,753,583 | 127.23M | Jun 29, 2026 |
| UBS Group AG | 3.39% | 13,355,131 | 45.01M | Jun 29, 2026 |
| Blackrock Inc. | 3.09% | 12,174,275 | 41.03M | Jun 29, 2026 |
| Vanguard Capital Management LLC | 2.03% | 8,018,928 | 27.02M | Jun 29, 2026 |
| Vanguard Portfolio Management LLC | 2.02% | 7,973,235 | 26.87M | Jun 29, 2026 |
Fund ownership
| Holder | % held | Shares | Value | Reported |
|---|---|---|---|---|
| VANGUARD INDEX FUNDS-Vanguard Total Stock Market Index Fund | 1.42% | 5,610,160 | 18.91M | Jun 29, 2026 |
| VANGUARD INDEX FUNDS-Vanguard Small-Cap Index Fund | 1.02% | 4,020,703 | 13.55M | Jun 29, 2026 |
| iShares Trust-iShares Russell 2000 ETF | 0.99% | 3,910,127 | 13.18M | Sep 29, 2026 |
| VANGUARD INDEX FUNDS-Vanguard Small-Cap Growth Index Fund | 0.59% | 2,309,940 | 7.78M | Jun 29, 2026 |
| VANGUARD INDEX FUNDS-Vanguard Extended Market Index Fund | 0.55% | 2,157,420 | 7.27M | Jun 29, 2026 |
| SPDR SERIES TRT-State Street SPDR S&P Kensho New Economies Composite E | 0.43% | 1,692,713 | 5.70M | Sep 29, 2026 |