

Kosmos Energy Ltd. KOS
2.25 USD -0.34 (-13.13%)
At closeNov 5, 2026, 5:40 AM EST
2.30 +0.05 +2.22%
Pre-market · Nov 5, 5:40 AM ET
2.17 Day range 2.47
0.84 52-week range 3.34
- YTD
- +147.25%
- 1 year
- +52.03%
- Market cap
- 1.34B
- Revenue (ttm)
- 1.68B
- Profit margin
- -27.38%
- EPS (ttm)
- -0.94
- Shares out
- 595.55M
- Forward P/E
- 6.34
- YTD return
- +147.25%
- 1-year return
- +52.03%
- Volume
- 27.15M
- Avg volume
- 13.31M
- Open
- 2.50
- Previous close
- 2.59
- Day's range
- 2.17 – 2.47
- 52-week range
- 0.84 – 3.34
- Beta
- 0.79
- Analysts
- Hold
- Price target
- 3.03 (+34.4%)
- Earnings date
- Mar 1, 2027
5D -0.51 (-18.48%)
Key statistics
- Enterprise value
- 4.10B
- PEG ratio
- 0.00
- Price / sales
- 0.80
- Price / book
- 2.01
- Dividend yield
- 0.00%
- Payout ratio
- 0.00%
- Revenue growth
- 31.80%
- Free cash flow
- 429.83M
- Total cash
- 103.75M
- Total debt
- 2.66B
- Return on equity
- -58.80%
- Short % of float
- 5.82%
- 50-day average
- 2.74
- 200-day average
- 2.53
Analyst view
Consensus: hold
Hold
Price target (mean) 3.03 +34.4% upside
Now 2.25
- Target (low)
- 1.70
- Target (mean)
- 3.03
- Target (high)
- 4.70
Ratings (0m) 13 5 buy · 5 hold · 3 sell
- Strong buy1
- Buy4
- Hold5
- Sell2
- Strong sell1
Next earnings
Mar 1, 2027
Expected Mar 1, 2027. Consensus EPS estimate 0.14.
Financials — quick view
KOS Revenue — quarterly 409.88M
KOS Net income — quarterly -43.01M
KOS EPS — quarterly -0.07
Earnings
| Report date | Quarter ending | EPS estimate | EPS reported | Surprise | Surprise % |
|---|---|---|---|---|---|
| Mar 1, 2027 | Dec 30, 2026 | 0.1666 | — | — | — |
| Nov 2, 2026 | Sep 30, 2026 | 0.1281 | 0.06 | -0.07 | -53.16% |
| Aug 3, 2026 | Jun 30, 2026 | 0.09324 | 0.11 | +0.02 | +17.98% |
| May 5, 2026 | Mar 31, 2026 | 0.07667 | -0.07 | -0.15 | -191.30% |
| Mar 2, 2026 | Dec 31, 2025 | -0.12799 | -0.16 | -0.03 | -25.01% |
| Nov 3, 2025 | Sep 30, 2025 | -0.136 | -0.15 | -0.01 | -10.29% |
Upgrades / downgrades
| Date | Firm | Action | From | To |
|---|---|---|---|---|
| Oct 28, 2026 | Jefferies | down | Buy | Hold |
| Jul 21, 2026 | Stephens & Co. | main | Equal-Weight | Equal-Weight |
| May 27, 2026 | Mizuho | down | Neutral | Underperform |
| Mar 25, 2026 | Johnson Rice | up | Accumulate | Buy |
| Jan 30, 2026 | Goldman Sachs | main | Neutral | Neutral |
| Jan 5, 2026 | Bernstein | main | Market Perform | Market Perform |
About Kosmos Energy Ltd.
Kosmos Energy Ltd., a deepwater exploration and production company, engages in the exploration, development, and production of oil and natural gas properties. It has oil and gas production projects in offshore Ghana, Equatorial Guinea, Mauritania, Senegal, and the Gulf of America. The company was founded in 2003 and is headquartered in Dallas, Texas.
- Sector
- Energy
- Industry
- Oil & Gas E&P
- Country
- United States
- Website
- kosmosenergy.com
News
 Kosmos Energy: 3 Key Takeaways for Long-Term Investors
 Kosmos Energy Ltd. (KOS) Q3 2026 Earnings Call Transcript
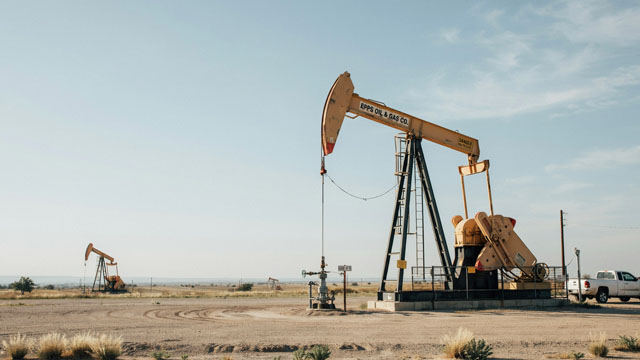 What Kosmos Energy (KOS) Said on Its Q3 Earnings Call
 Kosmos Energy Q3 2026 Earnings Call Transcript
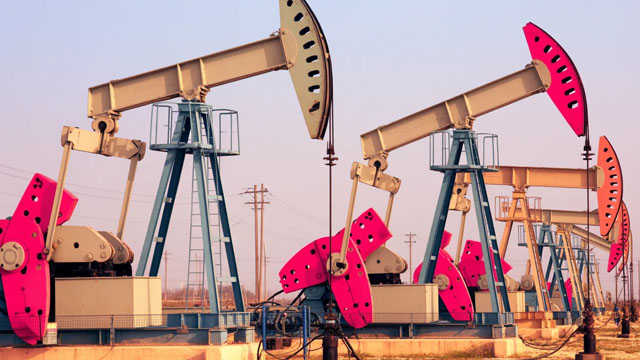 Kosmos Energy Posts Downbeat Q3 Results, Joins Once Upon A Farm And Other Big Stocks Moving Lower In Monday's Pre-Market Session
 Kosmos Energy Posts Downbeat Q3 Results, Joins Once Upon A Farm And Other Big Stocks Moving Lower In Monday’s Pre-Market Session
 Why Inovio Pharmaceuticals Shares Are Trading Higher By Over 230%; Here Are 20 Stocks Moving Premarket
 Kosmos Energy Q3 Adj. EPS $0.06 Misses $0.12 Estimate, Sales $409.880M Miss $455.349M Estimate
 Jefferies Downgrades Kosmos Energy to Hold, Raises Price Target to $2.9
Your note
Sign in to keep a note on KOS — it syncs with the Stock Master app.
Insider holders
| Insider | Relation | Latest transaction | Date | Shares held |
|---|---|---|---|---|
| Citadel, L.P. | — | Increase | Dec 15, 2024 | 7,373,376 |
| Cobas Asset Management, SGIIC, S.A. | — | Bought | Dec 15, 2024 | 13,503,294 |
| Legal & General Group Plc | — | Holding | Dec 12, 2024 | 567,106 |
Institution ownership
| Holder | % held | Shares | Value | Reported |
|---|---|---|---|---|
| Blackrock Inc. | 9.41% | 56,023,521 | 126.33M | Jun 29, 2026 |
| State Street Corporation | 4.95% | 29,453,016 | 66.42M | Jun 29, 2026 |
| Two Sigma Investments, LP | 4.26% | 25,398,092 | 57.27M | Jun 29, 2026 |
| Shaw D.E. & Co., Inc. | 4.12% | 24,538,308 | 55.33M | Jun 29, 2026 |
| Equinox Partners Investment Management, LLC | 3.47% | 20,678,033 | 46.63M | Jun 29, 2026 |
| Hotchkis & Wiley Capital Management, LLC | 3.16% | 18,844,781 | 42.49M | Jun 29, 2026 |
Fund ownership
| Holder | % held | Shares | Value | Reported |
|---|---|---|---|---|
| SPDR SERIES TRT-State Street SPDR S&P Oil & Gas Exploration & Producti | 3.02% | 18,004,521 | 40.60M | Sep 29, 2026 |
| American Century ETF Trust-Avantis U.S. Small Cap Value ETF | 2.62% | 15,602,866 | 35.18M | Sep 29, 2026 |
| iShares Trust-iShares Russell 2000 ETF | 2.58% | 15,377,979 | 34.68M | Sep 29, 2026 |
| AIM Sector Funds (Invesco Sector Funds)-Invesco Small Cap Value Fund | 1.49% | 8,853,928 | 19.97M | Jul 30, 2026 |
| GMO TRUST-GMO Resources Fund | 1.44% | 8,604,569 | 19.40M | Aug 30, 2026 |
| SCHWAB STRATEGIC TRUST-Schwab Fundamental U.S. Small Company ETF | 1.17% | 6,972,046 | 15.72M | Aug 30, 2026 |