

Indaptus Therapeutics, Inc. INDP
Regular-session close
After hours · Nov 19, 4:00 PM ET
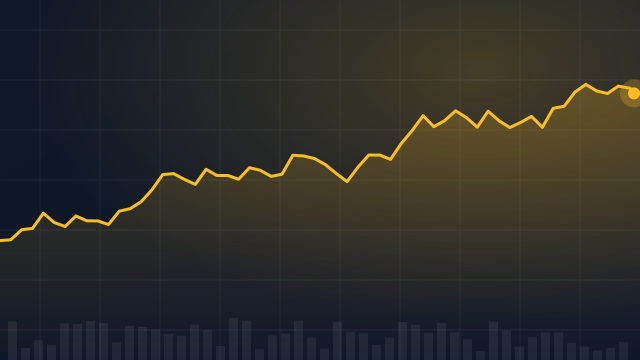
- YTD
- +7.56%
- 1 year
- +51.21%
5D +0.02 (+0.64%)
- Market cap
- 480.78M
- EPS (ttm)
- -3.16
- Shares out
- 12.01M
- Forward P/E
- -0.64
- YTD return
- +7.56%
- 1-year return
- +51.21%
- 50-day average
- 1.16
- 200-day average
- 1.81
- Volume
- 101.99K
- Avg volume
- 908.86K
- Open
- 3.25
- Previous close
- 3.29
- Day's range
- 3.10 – 3.31
- 52-week range
- 0.92 – 5.96
- Beta
- 1.13
- Price target
- 8.50 (+171.6%)
Key statistics
- Enterprise value
- 4.81M
- Price / book
- 0.62
- Free cash flow
- -7.41M
- Total cash
- 7.30M
- Total debt
- 130.80K
- Return on equity
- -127.04%
- Short % of float
- 1.83%
Fundamental scorecard
6 of 25 checks passed on INDP’s reported financials
6of 25 checks passed
- Value 0 of 5
- Growth 1 of 5
- Profitability 0 of 5
- Financial health 5 of 5
- Dividend 0 of 5
Statements to Sep 30, 2026.
Financials — quick view
Earnings
| Report date | Quarter ending | EPS estimate | EPS reported | Surprise | Surprise % |
|---|---|---|---|---|---|
| Nov 12, 2024 | Sep 1, 2024 | -0.47 | -0.32 | +0.15 | +31.91% |
| Aug 12, 2024 | Jun 1, 2024 | -0.54 | -0.47 | +0.07 | +12.96% |
| May 8, 2024 | Mar 1, 2024 | -0.57 | -0.45 | +0.12 | +21.05% |
| Mar 13, 2024 | Dec 1, 2023 | -0.54 | -0.47 | +0.07 | +12.96% |
| Nov 6, 2023 | Sep 1, 2023 | -0.55 | -0.47 | +0.08 | +14.55% |
| Aug 14, 2023 | Jun 1, 2023 | -0.58 | -0.39 | +0.19 | +32.76% |
Upgrades / downgrades
| Date | Firm | Action | From | To |
|---|---|---|---|---|
| Nov 13, 2024 | Maxim Group | main | Buy | Buy |
| Oct 16, 2024 | HC Wainwright & Co. | reit | Buy | Buy |
| Jun 17, 2024 | HC Wainwright & Co. | reit | Buy | Buy |
| Apr 15, 2024 | HC Wainwright & Co. | reit | Buy | Buy |
| Sep 20, 2023 | HC Wainwright & Co. | reit | Buy | Buy |
| Aug 15, 2023 | HC Wainwright & Co. | reit | Buy | Buy |
About Indaptus Therapeutics, Inc.
Indaptus Therapeutics, Inc., a clinical biotechnology company, develops various anti-cancer and anti-viral immunotherapy products. Its lead clinical candidate is Decoy20 used to produce single agent activity and/or combination therapy-based durable responses of lymphoma, hepatocellular, colorectal, and pancreatic tumors, and chronic hepatitis B virus, and human immunodeficiency virus infection, which is in Phase 2 clinical trial. The company was formerly known as Intec Parent, Inc. and changed its name to Indaptus Therapeutics, Inc. in August 2021. Indaptus Therapeutics, Inc. is headquartered in New York, New York.
- Sector
- Healthcare
- Industry
- Biotechnology
- Country
- United States
- Website
- indaptusrx.com
News
 Why Aytu Biopharma Shares Are Trading Higher By 43%; Here Are 20 Stocks Moving Premarket
 Indaptus Therapeutics Q3 EPS $(0.01) Up From $(2.98) YoY
 Indaptus Therapeutics Reports Third Quarter 2026 Financial Results and Provides Corporate Update
 Netflix, Intuitive Surgical, Pegasystems And Other Big Stocks Moving Lower In Wednesday’s Pre-Market Session
 Indaptus Therapeutics Reports Second Quarter 2026 Financial Results and Provides Corporate Update
 Abbott Cooper PLLC Announces Investigation on Behalf of Indaptus Therapeutics, Inc. Stockholders
 Indaptus Therapeutics Reports First Quarter 2026 Financial Results and Provides Corporate Update
 Comparing Indaptus Therapeutics (NASDAQ:INDP) & Aldeyra Therapeutics (NASDAQ:ALDX)
 Indaptus Therapeutics (INDP) Expected to Announce Quarterly Earnings on Thursday
 Indaptus Enters Into $6 Million Securities Purchase Agreement with Investor David E. Lazar
Your note
Sign in to keep a note on INDP — it syncs with the Stock Master app.
Insider holders
| Insider | Relation | Latest transaction | Date | Shares held |
|---|---|---|---|---|
| ANDERSON GLEN R | Beneficial Owner of more than 10% of a Class of Security | Purchase | Aug 13, 2023 | 0 |
| MECKLER JEFFREY A | Chief Executive Officer | Stock Award(Grant) | Nov 24, 2024 | 202,859 |
Institution ownership
| Holder | % held | Shares | Value | Reported |
|---|---|---|---|---|
| Vanguard Group Inc | 2.51% | 256,265 | 227.84K | Sep 29, 2024 |
| Investment House, LLC | 0.98% | 99,976 | 88.89K | Sep 29, 2024 |
| Geode Capital Management, LLC | 0.72% | 73,129 | 65.02K | Sep 29, 2024 |
| Strategy Asset Managers Llc | 0.44% | 45,336 | 40.31K | Sep 29, 2024 |
| Pine Valley Investments Ltd Liability Co. | 0.43% | 43,983 | 39.10K | Sep 29, 2024 |
| Renaissance Technologies, LLC | 0.27% | 27,100 | 24.09K | Sep 29, 2024 |
Fund ownership
| Holder | % held | Shares | Value | Reported |
|---|---|---|---|---|
| Vanguard Total Stock Market Index Fund | 2.25% | 229,197 | 203.78K | Sep 29, 2024 |
| Fidelity Extended Market Index Fund | 0.43% | 44,169 | 39.27K | Oct 30, 2024 |
| Vanguard Extended Market Index Fund | 0.27% | 27,068 | 24.07K | Sep 29, 2024 |
| Fidelity NASDAQ Composite Index Fund | 0.14% | 14,123 | 12.56K | Oct 30, 2024 |
| Fidelity Total Market Index Fund | 0.13% | 12,948 | 11.51K | Oct 30, 2024 |
| Fidelity Series Total Market Index Fund | 0.09% | 9,314 | 8.28K | Oct 30, 2024 |