

Infineon Technologies AG IFNNY
53.63 USD -2.08 (-3.73%)
Regular-session close
53.42 Day range 54.48
36.10 52-week range 103.28
- YTD
- +21.94%
- 1 year
- +31.29%
- Market cap
- 69.75B
- EPS (ttm)
- 1.32
- P/E ratio
- 40.63
- YTD return
- +21.94%
- 1-year return
- +31.29%
- Volume
- 94.15K
- Avg volume
- 385.07K
- Open
- 54.01
- Previous close
- 55.71
- Day's range
- 53.42 – 54.48
- 52-week range
- 36.10 – 103.28
5D +1.95 (+3.63%)
Fundamental scorecard
5 of 25 checks passed on IFNNY’s reported financials
5of 25 checks passed
- Value 0 of 5
- Growth 1 of 5
- Profitability 1 of 5
- Financial health 3 of 5
- Dividend 0 of 5
Statements to Sep 30, 2009.
Financials — quick view
IFNNY Revenue — annual 3.03B
IFNNY Net income — annual -623.00M
IFNNY EPS — annual -0.73
Earnings
| Report date | Quarter ending | EPS estimate | EPS reported | Surprise | Surprise % |
|---|---|---|---|---|---|
| Nov 11, 2026 | Sep 30, 2026 | 0.70 | — | — | — |
| Aug 5, 2026 | Jun 30, 2026 | 0.48 | 0.51 | +0.03 | +6.25% |
| May 6, 2026 | Mar 31, 2026 | 0.41 | 0.40 | -0.01 | -2.44% |
| Feb 4, 2026 | Dec 31, 2025 | 0.36 | 0.41 | +0.05 | +13.89% |
| Nov 12, 2025 | Sep 30, 2025 | 0.49 | 0.43 | -0.06 | -12.24% |
| Aug 5, 2025 | Jun 30, 2025 | 0.36 | 0.42 | +0.06 | +16.67% |
News
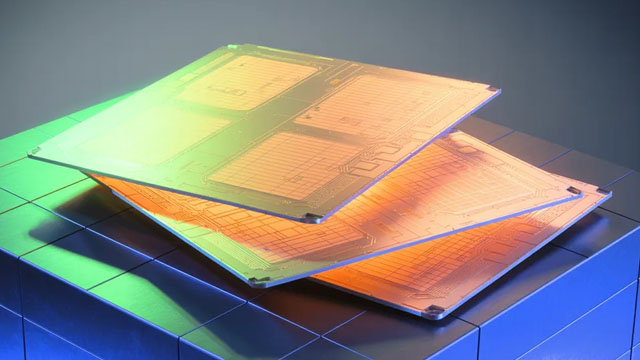 Infineon: Strong Buy As The Best Of The AI Boom Is Yet To Come
 Infineon Technologies AG (IFNNY) Presents at Deutsche Bank Virtual Investor Conference Transcript
 Infineon Technologies AG (IFNNY) Q4 2026 Earnings Call Transcript
 Infineon Technologies AG (IFNNY) Q4 2026 Press Conference Call Transcript
 TASKING's Unified Toolchain Supports Infineon's New AURIX™ RC1 RISC-V-based Automotive MCU Family with Industry's First AI-Enabled End-to-End Workflow
 Enphase Energy, Infineon Technologies Announces Deployment Of Enphase's 900 V Gallium Nitride Monolithic Bidirectional Switch Devices
Your note
Sign in to keep a note on IFNNY — it syncs with the Stock Master app.