

Hudbay Minerals Inc. HBM
21.45 USD -0.18 (-0.81%)
Nov 13, 2026, 2:55 PM EST
20.96 Day range 21.71
14.34 52-week range 32.15
- YTD
- +8.04%
- 1 year
- +35.21%
- Market cap
- 9.52B
- Revenue (ttm)
- 2.47B
- Profit margin
- 27.48%
- EPS (ttm)
- 1.71
- Shares out
- 444.14M
- P/E ratio
- 12.54
- Forward P/E
- 10.87
- Dividend
- 0.03 (0.13%)
- Ex-dividend date
- Sep 7, 2026
- YTD return
- +8.04%
- 1-year return
- +35.21%
- Volume
- 1.91M
- Avg volume
- 4.37M
- Open
- 21.60
- Previous close
- 21.62
- Day's range
- 20.96 – 21.71
- 52-week range
- 14.34 – 32.15
- Beta
- 2.36
- Analysts
- Strong Buy
- Price target
- 34.77 (+62.1%)
- Earnings date
- Feb 19, 2027
5D +1.01 (+4.90%)
Key statistics
- Enterprise value
- 10.36B
- PEG ratio
- 0.00
- Price / sales
- 3.89
- Price / book
- 2.00
- Dividend yield
- 0.13%
- Payout ratio
- 1.26%
- Revenue growth
- 17.70%
- Free cash flow
- 450.24M
- Total cash
- 890.90M
- Total debt
- 1.04B
- Return on equity
- 16.74%
- Short % of float
- 0.00%
- 50-day average
- 24.99
- 200-day average
- 24.74
Analyst view
Consensus: strong buy
Strong buy
Price target (mean) 34.77 +62.1% upside
Now 21.45
- Target (low)
- 31.50
- Target (mean)
- 34.77
- Target (high)
- 43.00
Ratings (0m) 23 22 buy · 1 hold · 0 sell
- Strong buy8
- Buy14
- Hold1
- Sell0
- Strong sell0
Next earnings
Feb 19, 2027
Expected Feb 19, 2027. Consensus EPS estimate 0.34649.
Financials — quick view
HBM Revenue — quarterly 631.30M
HBM Net income — quarterly 137.40M
HBM EPS — quarterly 0.34
Earnings
| Report date | Quarter ending | EPS estimate | EPS reported | Surprise | Surprise % |
|---|---|---|---|---|---|
| Feb 19, 2027 | Dec 30, 2026 | 0.36 | — | — | — |
| Nov 12, 2026 | Sep 30, 2026 | 0.35 | 0.34 | -0.01 | -2.86% |
| Jul 29, 2026 | Jun 30, 2026 | 0.2583 | 0.28 | +0.02 | +8.40% |
| May 1, 2026 | Mar 31, 2026 | 0.34 | 0.40 | +0.06 | +17.65% |
| Feb 20, 2026 | Dec 31, 2025 | 0.40 | 0.22 | -0.18 | -45.00% |
| Nov 12, 2025 | Sep 30, 2025 | 0.06 | 0.03 | -0.03 | -50.00% |
Upgrades / downgrades
| Date | Firm | Action | From | To |
|---|---|---|---|---|
| Jul 16, 2026 | Barclays | main | Overweight | Overweight |
| Jul 9, 2026 | B of A Securities | main | Buy | Buy |
| May 22, 2026 | Barclays | init | — | Overweight |
| Feb 11, 2026 | Citigroup | main | Buy | Buy |
| Dec 15, 2025 | Citigroup | init | — | Buy |
| Oct 16, 2025 | B of A Securities | main | Buy | Buy |
About Hudbay Minerals Inc.
Hudbay Minerals Inc., a diversified mining company, focuses on the exploration, development, operation, and optimization of properties in North and South America. It primarily explores for copper concentrates containing copper, gold, zinc, molybdenum concentrates, and silver. It owns 100% interest in Copper Mountain mine located approximately 20 kilometers south of Princeton, British Columbia, in the Similkameen valley. Hudbay Minerals Inc. was founded in 1927 and is based in Toronto, Canada.
- Sector
- Basic Materials
- Industry
- Copper
- Country
- Canada
- Website
- hudbayminerals.com
News
 Hudbay Minerals Inc. (HBM:CA) Q3 2026 Earnings Call Transcript
 Hudbay Minerals Q3 2026 Earnings Call Transcript
 HudBay Minerals (HBM) Reports Q3 Earnings: What Key Metrics Have to Say
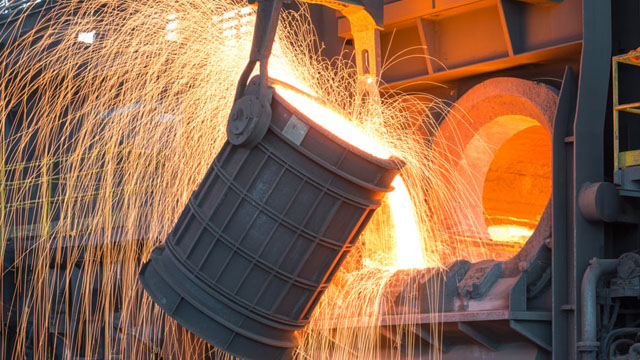 HudBay Minerals (HBM) Misses Q3 Earnings and Revenue Estimates
 Hudbay Minerals Q3 Adj. EPS $0.34 Misses $0.35 Estimate, Sales $765.900M Beat $725.506M Estimate
 Hudbay Delivers Record Third Quarter 2026 Results, Further Improves Cost Guidance and Advances Copper Growth Pipeline
 Cisco Systems, Applied Materials On Deck Thursday As AI Demand Faces Test
 SK hynix Rides the AI Data Center Boom and HBM4 Ramp-Up
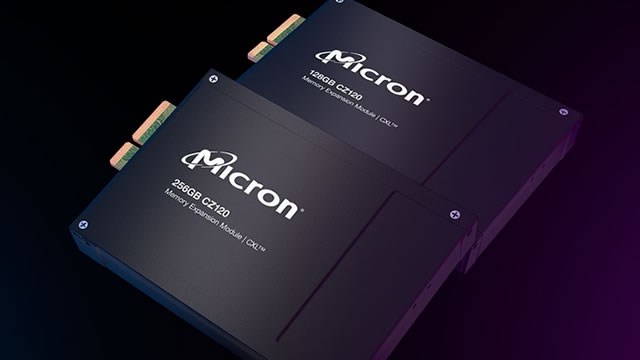 Micron: HBM Repricing Strengthens The Buy Case After The Selloff
 The Next AI Chip Shortage May Be the Machines That Make HBM
Your note
Sign in to keep a note on HBM — it syncs with the Stock Master app.
Insider holders
| Insider | Relation | Latest transaction | Date | Shares held |
|---|---|---|---|---|
| Brule (Candace) | Senior Officer of Issuer | Acquisition or disposition under a purchase/ownership plan | Dec 30, 2025 | 51,301 |
| Carter (Robert Alan) | Senior Officer of Issuer | Acquisition or disposition under a purchase/ownership plan | Dec 30, 2025 | 27,816 |
| Del Rio (Francisco Javier) | Senior Officer of Issuer | Exercise of options | Mar 8, 2026 | 64,748 |
| Donnelly, Patrick James | Senior Officer of Issuer | Acquisition or disposition under a purchase/ownership plan | Dec 30, 2025 | 111,939 |
| Dryden, Gregory Paul | Director or Senior Officer of Insider or Subsidiary of Issuer (other than in 4,5,6) | Exercise of options | May 27, 2026 | 35,453 |
| Kukielski (Peter Gerald Jan) | Director of Issuer | Acquisition or disposition in the public market | Mar 29, 2026 | 0 |
Institution ownership
| Holder | % held | Shares | Value | Reported |
|---|---|---|---|---|
| FIL LTD | 7.02% | 31,195,188 | 674.91M | Sep 29, 2026 |
| Mirae Asset Global ETFs Holdings Ltd. | 4.49% | 19,920,330 | 430.98M | Jun 29, 2026 |
| GMT Capital Corp | 4.12% | 18,281,369 | 395.52M | Jun 29, 2026 |
| Mackenzie Financial Corporation | 3.61% | 16,055,018 | 347.35M | Sep 29, 2026 |
| Hancock Prospecting Pty Ltd | 3.58% | 15,885,729 | 343.69M | Jun 29, 2026 |
| Royal Bank of Canada | 3.33% | 14,810,721 | 320.43M | Jun 29, 2026 |
Fund ownership
| Holder | % held | Shares | Value | Reported |
|---|---|---|---|---|
| GLOBAL X FUNDS-Global X Copper Miners ETF | 3.53% | 15,693,645 | 339.53M | Sep 29, 2026 |
| VANGUARD STAR FUNDS-Vanguard Total International Stock Index Fund | 1.41% | 6,251,819 | 135.26M | Jul 30, 2026 |
| VANGUARD TAX-MANAGED FUNDS-Vanguard Developed Markets Index Fund | 0.93% | 4,141,369 | 89.60M | Jun 29, 2026 |
| AIM Sector Funds (Invesco Sector Funds)-Invesco Small Cap Value Fund | 0.71% | 3,139,282 | 67.92M | Jul 30, 2026 |
| Vanguard Explorer Fund | 0.57% | 2,527,911 | 54.69M | Jul 30, 2026 |
| DFA INVESTMENT DIMENSIONS GROUP INC-Intl Core Eqy. 2 PORT. | 0.55% | 2,453,016 | 53.07M | Jul 30, 2026 |