

Galaxy Entertainment Group Limited GXYEF
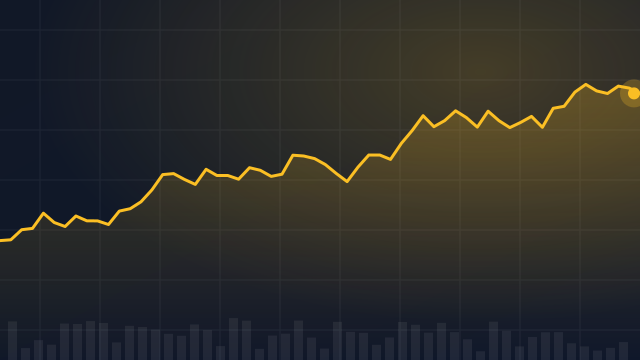
4.09 USD -0.03 (-0.73%)
Nov 4, 2026, 9:30 AM EST
4.09 Day range 4.09
3.65 52-week range 5.76
- YTD
- -21.19%
- 1 year
- -21.80%
- Market cap
- 17.91B
- EPS (ttm)
- 0.31
- P/E ratio
- 13.19
- YTD return
- -21.19%
- 1-year return
- -21.80%
- Volume
- 1.50K
- Avg volume
- 15.93K
- Open
- 4.09
- Previous close
- 4.12
- Day's range
- 4.09 – 4.09
- 52-week range
- 3.65 – 5.76
6M -0.05 (-1.12%)
Earnings
| Report date | Quarter ending | EPS estimate | EPS reported | Surprise | Surprise % |
|---|---|---|---|---|---|
| Feb 26, 2026 | Dec 31, 2025 | — | 0.1593 | — | — |
| Aug 12, 2025 | Jun 30, 2025 | 0.08026 | 0.1522 | +0.07 | +89.63% |
| Feb 27, 2025 | Dec 31, 2024 | — | 0.1287 | — | — |
| Aug 15, 2024 | Jun 30, 2024 | — | 0.1284 | — | — |
| May 14, 2024 | Dec 31, 2023 | 0.05392 | 0.1152 | +0.06 | +113.65% |
News
 Galaxy Entertainment Group (OTCMKTS:GXYEF) Stock Passes Below 50 Day Moving Average – Should You Sell?
 Galaxy Entertainment Group Q2 & Interim Results 2025
 Galaxy Entertainment: A Beneficiary Of Internal And External Tailwinds (Upgrade)
 Galaxy Entertainment COO discusses state of Macao's gaming industry
 Galaxy Entertainment Group Selected Unaudited Q3 2024 Financial Data
 Galaxy Entertainment Group Limited (GXYEF) Q4 2023 Earnings Call Transcript
 Galaxy Entertainment Group Reports Q4 & Annual 2023 Results
 Galaxy Entertainment Group Selected Unaudited Q3 2023 Financial Data
 Macau Gaming Recovery Speeds Up, But Key Stocks Still Undervalued
 Stocks That Hit 52-Week Highs On Friday
Your note
Sign in to keep a note on GXYEF — it syncs with the Stock Master app.