

Green Thumb Industries Inc. GTBIF
6.65 USD -0.10 (-1.48%)
Nov 4, 2026, 1:08 PM EST
6.55 Day range 6.94
5.29 52-week range 10.43
- YTD
- -17.29%
- 1 year
- -0.89%
- Market cap
- 1.45B
- EPS (ttm)
- 0.54
- P/E ratio
- 12.31
- YTD return
- -17.29%
- 1-year return
- -0.89%
- Volume
- 74.02K
- Avg volume
- 495.43K
- Open
- 6.80
- Previous close
- 6.75
- Day's range
- 6.55 – 6.94
- 52-week range
- 5.29 – 10.43
- Earnings date
- Nov 4, 2026
2Y -4.13 (-38.67%)
Next earnings
Nov 4, 2026
Expected Nov 4, 2026. Consensus EPS estimate 0.01.
Earnings
| Report date | Quarter ending | EPS estimate | EPS reported | Surprise | Surprise % |
|---|---|---|---|---|---|
| Nov 4, 2026 | Sep 30, 2026 | 0.01 | — | — | — |
| Aug 4, 2026 | Jun 30, 2026 | 0.01 | 0.02 | +0.01 | +100.00% |
| May 6, 2026 | Mar 31, 2026 | 0.01997 | 0.07 | +0.05 | +250.53% |
| Feb 25, 2026 | Dec 31, 2025 | 0.01275 | 0.35 | +0.34 | +2,645.10% |
| Nov 5, 2025 | Sep 30, 2025 | 0.03 | 0.04 | +0.01 | +33.33% |
| Aug 6, 2025 | Jun 30, 2025 | 0.04 | -0.01 | -0.05 | -125.00% |
News
 Green Thumb Industries Enters Polk County with Its 27th Florida Location, RISE Dispensary Mulberry
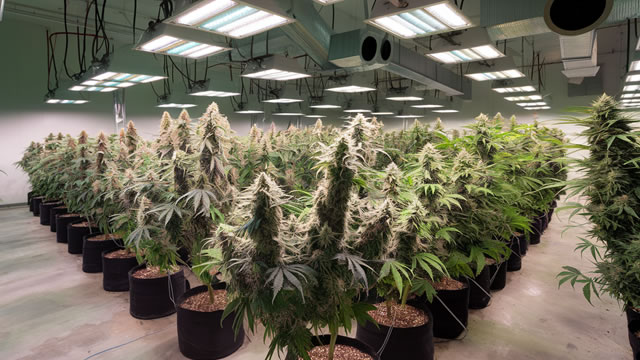 Forget Rescheduling: Green Thumb's Cash Flow Is the Real Reason to Own It
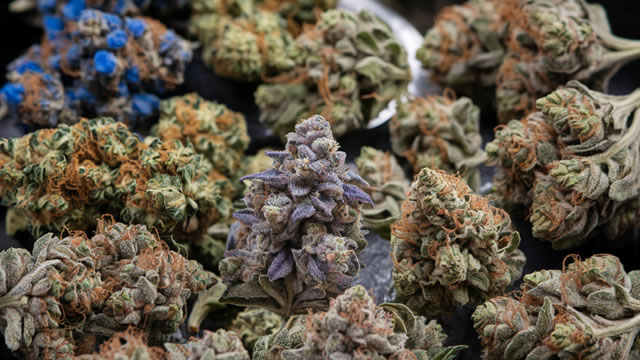 President Trump's Push to Reschedule Marijuana Hit a Snag. Is Green Thumb Still a Buy?
 Green Thumb Deepens Marion County Roots with Opening of RISE Dispensary Belleview, Its 26th Florida Location
 Green Thumb Industries (OTCMKTS:GTBIF) Shares Gap Down – Should You Sell?
 3 Cannabis Stocks to Watch Heading Out of September
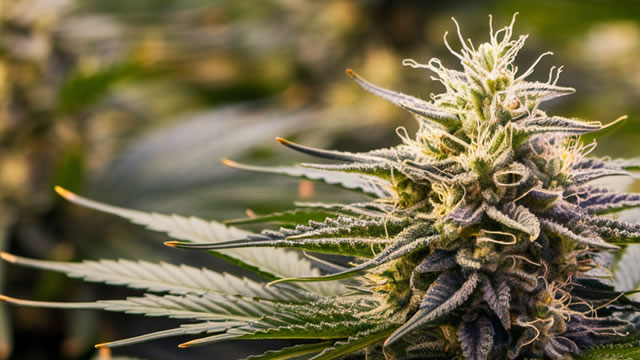 Green Thumb Industries: Is This Profitable Cannabis Stock Still Undervalued?
 Green Thumb Industries to Report Third Quarter 2026 Financial Results on November 4, 2026
 Green Thumb Industries Announces $50 Million Share Repurchase Program
 Analysts Think Green Thumb Industries Will Double Over the Next 12 Months. Here's Why They're Probably Wrong
Your note
Sign in to keep a note on GTBIF — it syncs with the Stock Master app.