

The Goldman Sachs Group, Inc. GS
Nov 11, 2026, 10:31 AM EST
- YTD
- +4.88%
- 1 year
- +13.77%
- Market cap
- 266.01B
- Revenue (ttm)
- 71.04B
- Profit margin
- 31.21%
- EPS (ttm)
- 69.55
- Shares out
- 288.43M
- P/E ratio
- 13.26
- Forward P/E
- 12.26
- Dividend
- 20.00 (2.16%)
- Ex-dividend date
- Dec 1, 2026
- YTD return
- +4.88%
- 1-year return
- +13.77%
- Volume
- 304.56K
- Avg volume
- 2.12M
- Open
- 927.50
- Previous close
- 910.19
- Day's range
- 912.86 – 928.38
- 52-week range
- 773.70 – 1,152.07
- Beta
- 1.27
- Analysts
- Buy
- Price target
- 1,030.67 (+11.8%)
- Earnings date
- Jan 19, 2027
5D -6.79 (-0.73%)
Key statistics
- Enterprise value
- 73.84B
- PEG ratio
- 1.09
- Price / sales
- 3.70
- Price / book
- 2.48
- Dividend yield
- 2.21%
- Payout ratio
- 25.88%
- Revenue growth
- 23.30%
- Free cash flow
- 0
- Total cash
- 1.16T
- Total debt
- 949.43B
- Return on equity
- 17.71%
- Short % of float
- 2.42%
- 50-day average
- 929.96
- 200-day average
- 956.13
Analyst view
Consensus: buy
- Target (low)
- 730.00
- Target (mean)
- 1,030.67
- Target (high)
- 1,250.00
- Strong buy1
- Buy8
- Hold15
- Sell1
- Strong sell1
Next earnings
Jan 19, 2027
Expected Jan 19, 2027. Consensus EPS estimate 16.03.
Financials — quick view
Earnings
| Report date | Quarter ending | EPS estimate | EPS reported | Surprise | Surprise % |
|---|---|---|---|---|---|
| Jan 19, 2027 | Dec 30, 2026 | 15.93 | — | — | — |
| Oct 13, 2026 | Sep 30, 2026 | 12.86 | 17.01 | +4.15 | +32.27% |
| Jul 14, 2026 | Jun 30, 2026 | 14.54 | 20.98 | +6.44 | +44.29% |
| Apr 13, 2026 | Mar 31, 2026 | 16.47 | 17.55 | +1.08 | +6.56% |
| Jan 15, 2026 | Dec 31, 2025 | 11.70 | 14.01 | +2.31 | +19.74% |
| Oct 14, 2025 | Sep 30, 2025 | 11.03 | 12.25 | +1.22 | +11.06% |
Upgrades / downgrades
| Date | Firm | Action | From | To |
|---|---|---|---|---|
| Nov 2, 2026 | UBS | main | Neutral | Neutral |
| Oct 23, 2026 | Freedom Broker | up | Hold | Buy |
| Oct 19, 2026 | BMO Capital | main | Market Perform | Market Perform |
| Oct 16, 2026 | JP Morgan | main | Neutral | Neutral |
| Oct 14, 2026 | Citigroup | main | Neutral | Neutral |
| Oct 14, 2026 | Keefe, Bruyette & Woods | main | Market Perform | Market Perform |
About The Goldman Sachs Group, Inc.
The Goldman Sachs Group, Inc., a financial institution, provides a range of financial services for corporations, financial institutions, governments, and individuals in the Americas, Europe, the Middle East, Africa, and Asia. It operates through three segments: Global Banking & Markets, Asset & Wealth Management, and Platform Solutions. The Global Banking & Markets segment provides financial advisory services, including strategic advisory assignments related to mergers and acquisitions, divestitures, corporate defense activities, restructurings, and spin-offs; equity and debt underwriting of public offerings and private placements; relationship lending and acquisition financing; secured lending through structured credit and asset-backed lending, such as warehouse, residential and commercial mortgage, corporate, consumer, auto, and student loans; financing through securities purchased under agreements to resell; and commodity financing through structured transactions. This segment also offers client execution activities for cash and derivative instruments; credit and interest rate products; and provision of mortgages, currencies, commodities, and equities related products. Its Asset & Wealth Management segment manages assets across various classes, including equity, fixed income, hedge funds, credit funds, private equity, real estate, currencies, commodities, and asset allocation strategies; and provides customized investment advisory solutions, wealth advisory services, personalized financial planning, and private banking services, as well as invests in corporate equity, credit, real estate, and infrastructure assets. The Platform Solutions segment offers credit cards; and transaction banking and other services, such as deposit-taking, payment solutions, and other cash management services for corporate and institutional clients. The Goldman Sachs Group, Inc. was founded in 1869 and is headquartered in New York, New York.
- Sector
- Financial Services
- Industry
- Capital Markets
- Country
- United States
- Website
- goldmansachs.com
News
 Anthropic IPO Could Top $1.5 Trillion Valuation as Banks Weigh Higher Pricing Amid Strong Investor Demand, Potentially Raising Over $100 Billion: Report
 Micron (MU) Stock Is Trending Pre-Market: Here’s What You Should Know
 Is Goldman Sachs an Attractive Investment Option Heading into 2027?
 Goldman Sachs, Citi Back $270M Stablecoin Venture to Challenge Tether, Circle
 AI Could Force 11 Million Americans to Change Careers. At 60, Five More Years Earning $70,000 Could Replace Five Zero Years in Social Security
 Morgan Stanley Climbs 4% on Vinyl Equity Deal to Capture IPO Wealth; Goldman Sachs Rises 5%, JPMorgan Gains 2%
 Goldman Sachs CEO: Data center infrastructure will be important as the economy moves forward
 Goldman Sachs (GS) Boasts Earnings & Price Momentum: Should You Buy?
 The 401(k) Crypto Rule Is in Its Final White House Review. Could Retirement Money Start Flowing Into Bitcoin in 2027?
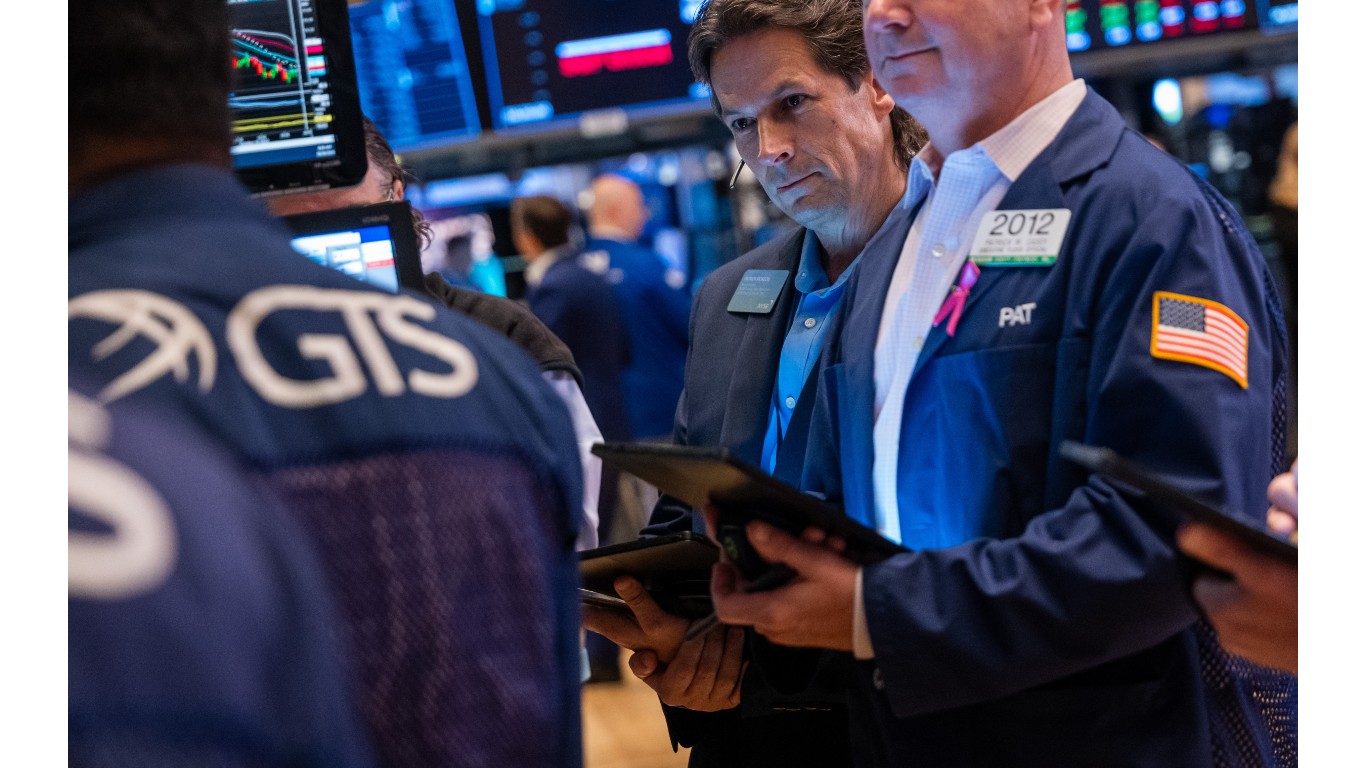 Wall Street Just Set a Record That Could Signal Trouble for the Stock Market
Your note
Sign in to keep a note on GS — it syncs with the Stock Master app.
Insider holders
| Insider | Relation | Latest transaction | Date | Shares held |
|---|---|---|---|---|
| COLEMAN DENIS P. | Chief Financial Officer | Conversion of Exercise of derivative security | Oct 22, 2026 | 51,676 |
| FREDMAN SHEARA J. | Officer | Conversion of Exercise of derivative security | Oct 22, 2026 | 14,525 |
| HESS JOHN B JR. | Director | Purchase | Apr 14, 2025 | 3,904 |
| LESLIE ERICKA T | Officer | Sale | Oct 27, 2026 | 10,500 |
| MONTAG THOMAS K | Director | Sale | Nov 11, 2024 | 0 |
| ROGERS JOHN F W | Officer | Conversion of Exercise of derivative security | Oct 22, 2026 | 115,481 |
Institution ownership
| Holder | % held | Shares | Value | Reported |
|---|---|---|---|---|
| Blackrock Inc. | 8.29% | 23,900,376 | 21.76B | Jun 29, 2026 |
| State Street Corporation | 6.53% | 18,830,464 | 17.14B | Jun 29, 2026 |
| Vanguard Capital Management LLC | 6.39% | 18,425,670 | 16.77B | Jun 29, 2026 |
| JPMORGAN CHASE & CO | 2.79% | 8,039,070 | 7.32B | Jun 29, 2026 |
| Vanguard Portfolio Management LLC | 2.50% | 7,215,421 | 6.57B | Jun 29, 2026 |
| Fisher Asset Management, LLC | 2.46% | 7,081,969 | 6.45B | Sep 29, 2026 |
Fund ownership
| Holder | % held | Shares | Value | Reported |
|---|---|---|---|---|
| VANGUARD INDEX FUNDS-Vanguard Total Stock Market Index Fund | 3.01% | 8,689,014 | 7.91B | Jun 29, 2026 |
| VANGUARD INDEX FUNDS-Vanguard 500 Index Fund | 2.46% | 7,086,401 | 6.45B | Jun 29, 2026 |
| SPDR DOW JONES INDUSTRIAL AVERAGE ETF TRT-State Street SPDR Dow Jones | 1.77% | 5,098,960 | 4.64B | Sep 29, 2026 |
| iShares Trust-iShares Core S&P 500 ETF | 1.35% | 3,879,973 | 3.53B | Sep 29, 2026 |
| Fidelity Concord Street Trust-Fidelity 500 Index Fund | 1.31% | 3,784,048 | 3.44B | Sep 29, 2026 |
| SPDR S&P 500 ETF TRUST-State Street SPDR S&P 500 ETF Trust | 1.25% | 3,602,247 | 3.28B | Sep 29, 2026 |