

iShares GNMA Bond ETF GNMA
42.66 USD -0.25 (-0.57%)
At closeNov 10, 2026, 4:00 PM EST
43.90 +1.24 +2.91%
After hours · Nov 10, 4:00 PM ET
42.45 Day range 42.75
41.31 52-week range 45.49
- YTD
- -4.22%
- 1 year
- -4.14%
- Market cap
- 432.12M
- YTD return
- -4.22%
- 1-year return
- -4.14%
- Volume
- 19.63K
- Avg volume
- 48.79K
- Open
- 42.45
- Previous close
- 42.91
- Day's range
- 42.45 – 42.75
- 52-week range
- 41.31 – 45.49
5D -0.21 (-0.49%)
Key statistics
- Enterprise value
- 0
- PEG ratio
- 0.00
- Price / sales
- 0.00
- Price / book
- 0.00
- Dividend yield
- 0.00%
- Payout ratio
- 0.00%
- Short % of float
- 0.00%
- 50-day average
- 43.59
- 200-day average
- 43.56
About iShares GNMA Bond ETF
The fund will invest at least 80% of its assets in the component securities of the underlying index and to-be-announced transactions (“TBAs”) that have economic characteristics that are substantially identical to the economic characteristics of the component securities of the underlying index. The underlying index includes fixed-rate MBS issued by GNMA that have 30- or 15-year maturities. The index measures the performance of mortgage-backed pass-through securities issued by GNMA.
News
 Notes from the Desk: All Aboard the MBS Train
 iShares Slashes Fees On 8 ETFs
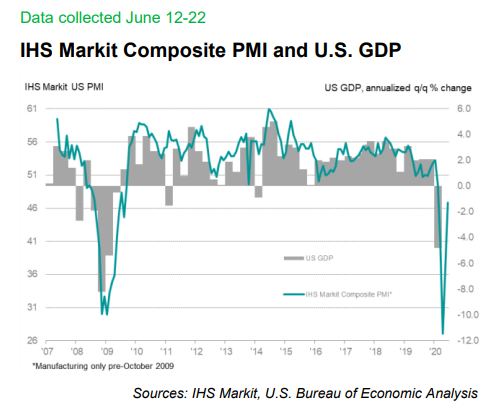 The Reopening Killed The V-Shaped Recovery
 Ladenburg Thalmann Financial Services Inc. Sells 556 Shares of iShares GNMA Bond ETF (NASDAQ:GNMA)
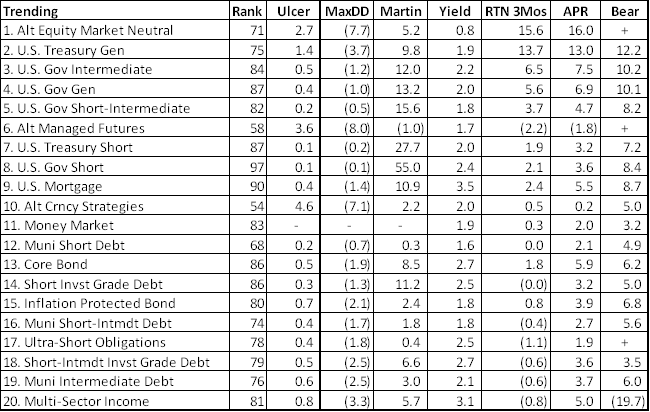 Reviewing Funds For Risk Adjusted Performance
 Task Force Created to Solve Liquidity Crunch Among Mortgage Firms
 For Bonds It's Probably 'Game Over'
 Performance Of Low-Risk Vanguard Portfolio Year To Date
 BlackRock's iShares Struts Its Low Fee ETF Stuff
Your note
Sign in to keep a note on GNMA — it syncs with the Stock Master app.