

SPDR Gold Shares GLD
359.26 USD -2.39 (-0.66%)
At closeNov 3, 2026, 4:00 PM EST
360.39 +1.13 +0.32%
After hours · Nov 3, 4:00 PM ET
358.94 Day range 361.86
354.67 52-week range 509.70
- YTD
- -9.35%
- 1 year
- -2.58%
- Market cap
- 132.11B
- EPS (ttm)
- -9.39
- YTD return
- -9.35%
- 1-year return
- -2.58%
- Volume
- 6.02M
- Avg volume
- 9.83M
- Open
- 361.33
- Previous close
- 361.65
- Day's range
- 358.94 – 361.86
- 52-week range
- 354.67 – 509.70
YTD -39.02 (-9.80%)
Key statistics
- Enterprise value
- 0
- PEG ratio
- 0.00
- Price / sales
- 0.00
- Price / book
- 0.00
- Dividend yield
- 0.00%
- Payout ratio
- 0.00%
- Revenue growth
- 0.00%
- Free cash flow
- 0
- Total cash
- 0
- Total debt
- 0
- Return on equity
- 0.00%
- Short % of float
- 0.00%
- 50-day average
- 389.34
- 200-day average
- 412.61
Next earnings
Consensus EPS estimate 0.00.
Earnings
| Report date | Quarter ending | EPS estimate | EPS reported | Surprise | Surprise % |
|---|---|---|---|---|---|
| Mar 30, 2023 | Mar 31, 2023 | — | 0.01853 | — | — |
| Dec 30, 2022 | Dec 31, 2022 | — | 0.01549 | — | — |
| Sep 29, 2022 | Sep 30, 2022 | — | -0.01507 | — | — |
| Jun 29, 2022 | Jun 30, 2022 | — | -0.01713 | — | — |
| Mar 30, 2022 | Mar 31, 2022 | — | 15,071.92 | — | — |
| Dec 30, 2006 | Dec 31, 2006 | — | -0.0235 | — | — |
About SPDR Gold Shares
The Trust holds gold bars and from time to time, issues Baskets in exchange for deposits of gold and distributes gold in connection with redemptions of Baskets. The investment objective of the Trust is for the Shares to reflect the performance of the price of gold bullion, less the Trust’s expenses. The Sponsor believes that, for many investors, the Shares represent a cost-effective investment in gold.
News
 Gold's October correction was overdone - Commerzbank
 Frank Giustra says ‘dozens of black swans' are waiting, here's why he won't sell his gold
 Gold demand remains near record highs as central bank buying surges 42% – WGC
 Central Banks Accelerated Gold Buying in Third Quarter
 $80 Billion Hedge Fund Braces for Bear Market
 Gold (XAUUSD) & Silver Price Forecast: US Midterms in Focus, Can Gold Reclaim $3,975?
 Gold Edges Higher Amid Better Investor Sentiment
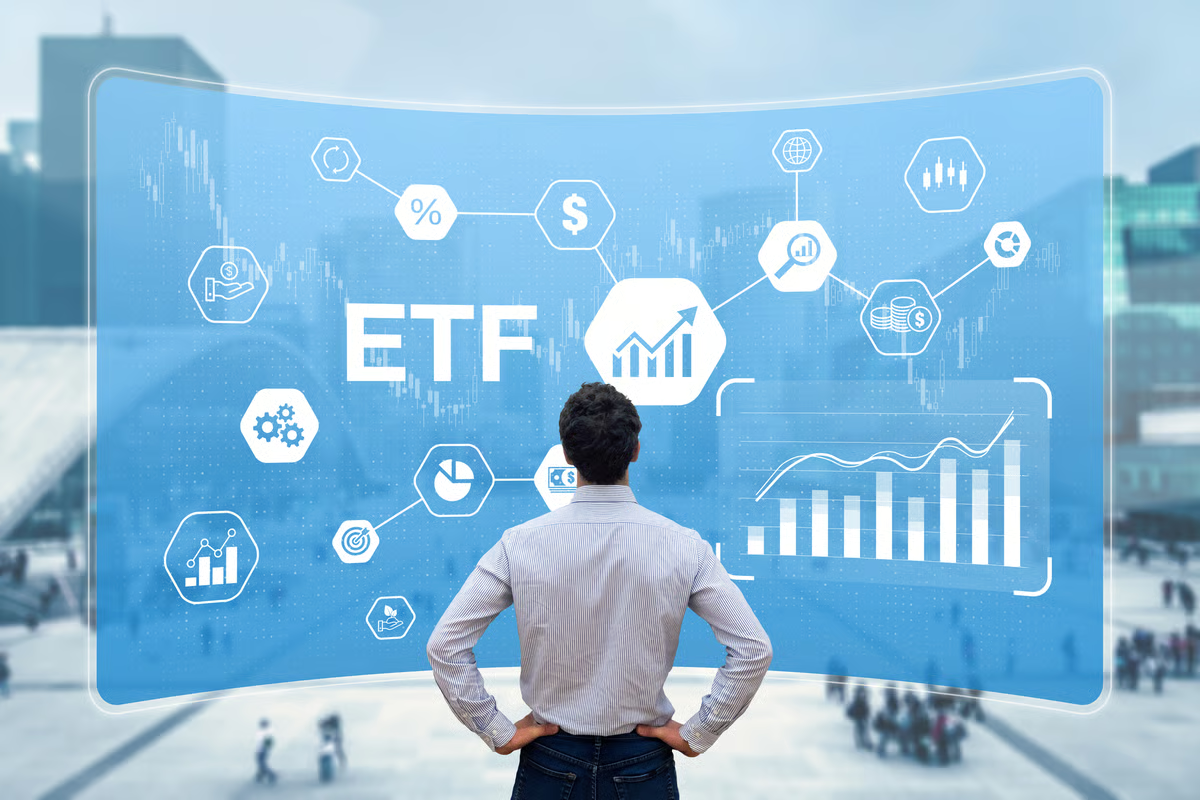 If the Fed Raises Interest Rates Again in 2026, I Predict These ETFs Will Be the Smartest Buys
 Gold and Silver Forecast: Rebound Faces Fed Hike Pressure
 Gold Rises, But Expectations of Tighter U.S. Monetary Policy Weigh
Your note
Sign in to keep a note on GLD — it syncs with the Stock Master app.