

GLOBALFOUNDRIES Inc. GFS
As ofNov 20, 2026, 3:43 PM EST
- YTD
- +2.56%
- 1 year
- +11.09%
5D -3.47 (-8.76%)
- Market cap
- 19.97B
- Revenue (ttm)
- 7.15B
- Profit margin
- 2.76%
- EPS (ttm)
- 0.35
- Shares out
- 557.45M
- P/E ratio
- 102.33
- Forward P/E
- 14.98
- Dividend
- 0.48 (1.21%)
- Ex-dividend date
- Dec 22, 2026
- YTD return
- +2.56%
- 1-year return
- +11.09%
- Volume
- 2.81M
- Avg volume
- 4.77M
- Open
- 37.85
- Previous close
- 38.94
- Day's range
- 35.17 – 38.44
- 52-week range
- 32.21 – 92.55
- Beta
- 1.85
- Analysts
- Buy
- Price target
- 64.77 (+80.9%)
- Earnings date
- Feb 10, 2027
- 50-day average
- 45.21
Key statistics
- 200-day average
- 54.97
- Enterprise value
- 21.72B
- PEG ratio
- 0.59
- Price / sales
- 3.04
- Price / book
- 1.82
- Payout ratio
- 68.57%
- Revenue growth
- 12.50%
- Free cash flow
- 440.12M
- Total cash
- 2.26B
- Total debt
- 1.72B
- Return on equity
- 1.69%
- Short % of float
- 14.85%
Fundamental scorecard
14 of 25 checks passed on GFS’s reported financials
14of 25 checks passed
- Value 2 of 5
- Growth 5 of 5
- Profitability 2 of 5
- Financial health 5 of 5
- Dividend No data
Statements to Sep 30, 2026.
Analyst view
Consensus: buy
- Target (low)
- 43.00
- Target (mean)
- 64.77
- Target (high)
- 140.00
- Strong buy3
- Buy10
- Hold9
- Sell0
- Strong sell1
Next earnings
Feb 10, 2027
Expected Feb 10, 2027. Consensus EPS estimate 0.59094.
Financials — quick view
Earnings
| Report date | Quarter ending | EPS estimate | EPS reported | Surprise | Surprise % |
|---|---|---|---|---|---|
| Feb 10, 2027 | Dec 30, 2026 | 0.59 | — | — | — |
| Nov 4, 2026 | Sep 30, 2026 | 0.512 | 0.53 | +0.02 | +3.52% |
| Aug 5, 2026 | Jun 30, 2026 | 0.4328 | 0.46 | +0.03 | +6.28% |
| May 5, 2026 | Mar 31, 2026 | 0.3512 | 0.40 | +0.05 | +13.90% |
| Feb 11, 2026 | Dec 31, 2025 | 0.4746 | 0.55 | +0.08 | +15.89% |
| Nov 12, 2025 | Sep 30, 2025 | 0.3833 | 0.41 | +0.03 | +6.97% |
Upgrades / downgrades
| Date | Firm | Action | From | To |
|---|---|---|---|---|
| Nov 5, 2026 | Jefferies | main | Hold | Hold |
| Nov 5, 2026 | UBS | main | Neutral | Neutral |
| Nov 5, 2026 | JP Morgan | main | Neutral | Neutral |
| Nov 5, 2026 | Citigroup | main | Neutral | Neutral |
| Nov 5, 2026 | TD Cowen | main | Buy | Buy |
| Nov 5, 2026 | Evercore ISI Group | main | Outperform | Outperform |
About GLOBALFOUNDRIES Inc.
GLOBALFOUNDRIES Inc., a semiconductor foundry, provides range of mainstream wafer fabrication services and technologies in the United States, Europe, the Middle East, Africa, and internationally. It offers semiconductor devices, including microprocessors, mobile application processors, baseband processors, network processors, radio frequency modems, microcontrollers, and power management units. The company also provides quantum technology solutions. GLOBALFOUNDRIES Inc. has a strategic partnership with the U.S. Department of Energy's Genesis Mission to accelerate scientific discovery through artificial intelligence and advanced computing; and Xanadu Quantum Technologies Limited to accelerate utility-scale quantum manufacturing. The company was incorporated in 2008 and is headquartered in Malta, New York.
- Sector
- Technology
- Industry
- Semiconductors
- Country
- United States
- Website
- gf.com
News
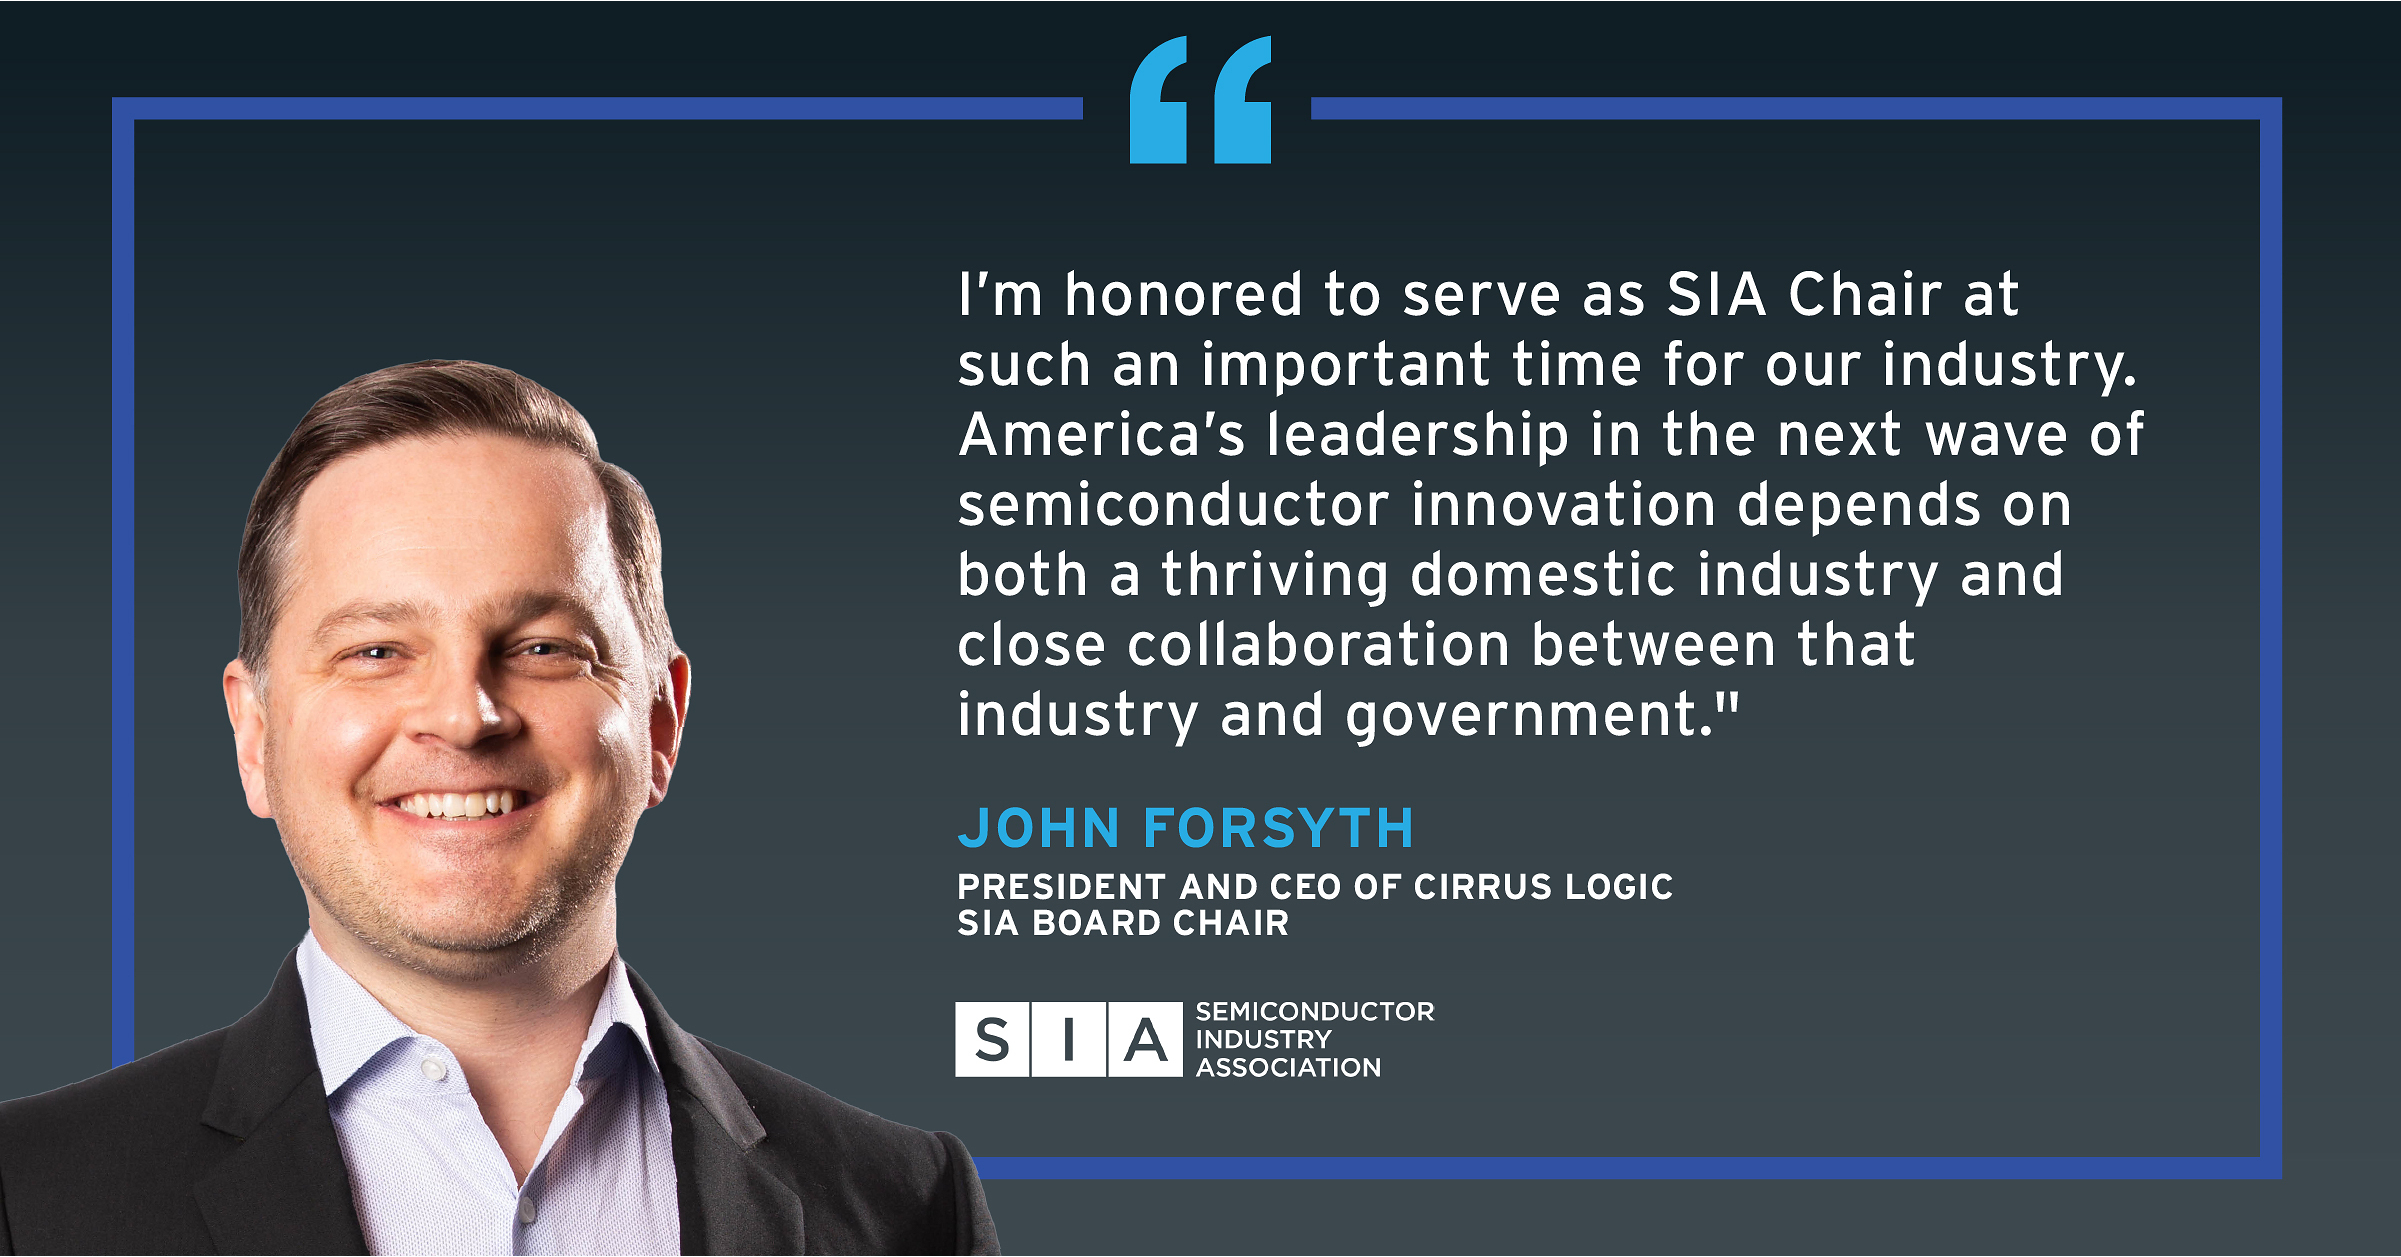 John Forsyth, Cirrus Logic President and CEO, Elected Chair of Semiconductor Industry Association
 GlobalFoundries Inc. $GFS Stock: Bessemer Group Inc. Raises Position
 TSM's $2 Billion Packaging Deal Could Ease a Critical AI Bottleneck
 Cohu (NASDAQ:COHU) versus GlobalFoundries (NASDAQ:GFS) Head-To-Head Comparison
 Trump's Manufacturing Boom Claims Are 'Not True,' Peter Schiff Says as Factory Spending Falls Over 21%
 GlobalFoundries: 3 Key Takeaways for Long-Term Investors
 GlobalFoundries breaks ground on first new semiconductor fab under landmark U.S.-Japan initiative
 What's Going On With Xanadu Quantum Stock Thursday?
 Jefferies Maintains Hold on GLOBALFOUNDRIES, Lowers Price Target to $50
 UBS Maintains Neutral on GLOBALFOUNDRIES, Lowers Price Target to $43
Your note
Sign in to keep a note on GFS — it syncs with the Stock Master app.
Insider holders
| Insider | Relation | Latest transaction | Date | Shares held |
|---|---|---|---|---|
| ANTAKI MARC | Director | Stock Award(Grant) | Jul 27, 2026 | 5,306 |
| AZAR SAMAK L | Officer | Sale | Sep 9, 2026 | 9,799 |
| DORCHAK GLENDA MARY | Director | Sale | Jul 19, 2026 | 14,867 |
| HALAWA SAMER | Director | Stock Award(Grant) | Jul 27, 2026 | 13,713 |
| HOGAN MICHAEL JAMES | Officer | Sale | Jul 21, 2026 | 0 |
| LANGUILLE CAMILLA | Director | Stock Award(Grant) | Jul 27, 2026 | 14,093 |
Institution ownership
| Holder | % held | Shares | Value | Reported |
|---|---|---|---|---|
| Mubadala Investment Co PJSC | 72.82% | 399,573,756 | 15.56B | Sep 29, 2026 |
| FMR, LLC | 8.21% | 45,043,140 | 1.75B | Sep 29, 2026 |
| Victory Capital Management Inc. | 1.29% | 7,062,419 | 275.01M | Sep 29, 2026 |
| Two Sigma Investments, LP | 1.23% | 6,776,416 | 263.87M | Sep 29, 2026 |
| Morgan Stanley | 0.67% | 3,688,158 | 143.62M | Sep 29, 2026 |
| Qube Research & Technologies Ltd | 0.65% | 3,579,491 | 139.39M | Sep 29, 2026 |
Fund ownership
| Holder | % held | Shares | Value | Reported |
|---|---|---|---|---|
| Fidelity Select Portfolios-Select Semiconductors Portfolio | 4.41% | 24,180,367 | 941.58M | Sep 29, 2026 |
| Fidelity Select Portfolios-Technology Portfolio | 1.79% | 9,839,931 | 383.17M | Sep 29, 2026 |
| Fidelity Advisor Series VII-Fidelity Advisor Semiconductors Fund | 0.70% | 3,816,192 | 148.60M | Sep 29, 2026 |
| Fidelity Rutland Square TRT II-Strategic Advisers Fidelity U.S. Total | 0.28% | 1,550,251 | 60.37M | Sep 29, 2026 |
| Victory Portfolios IV-Victory Pioneer Fund | 0.24% | 1,305,594 | 50.84M | Jun 29, 2026 |
| Old Westbury Funds Inc-Old Westbury Large Cap Strategies Fund | 0.23% | 1,267,098 | 49.34M | Jul 30, 2026 |