

Greenfire Resources Ltd. GFR
7.71 USD -0.03 (-0.32%)
Nov 10, 2026, 11:11 AM EST
7.70 Day range 7.73
4.15 52-week range 7.81
- YTD
- +61.87%
- 1 year
- +67.50%
- Market cap
- 1.85B
- Revenue (ttm)
- 581.47M
- Profit margin
- -6.35%
- EPS (ttm)
- -0.20
- Shares out
- 240.41M
- Forward P/E
- 13.59
- YTD return
- +61.87%
- 1-year return
- +67.50%
- Volume
- 1.18M
- Avg volume
- 1.35M
- Open
- 7.73
- Previous close
- 7.73
- Day's range
- 7.70 – 7.73
- 52-week range
- 4.15 – 7.81
- Beta
- 0.16
- Analysts
- Buy
5D +1.80 (+30.51%)
Key statistics
- Enterprise value
- 731.56M
- PEG ratio
- 0.00
- Price / sales
- 3.20
- Price / book
- 1.19
- Dividend yield
- 0.00%
- Payout ratio
- 0.00%
- Revenue growth
- 21.90%
- Free cash flow
- -59.22M
- Total cash
- 2.96M
- Total debt
- 32.12M
- Return on equity
- -3.63%
- Short % of float
- 0.64%
- 50-day average
- 6.32
- 200-day average
- 6.11
Analyst view
Consensus: buy
Buy
Price target (mean) —
Ratings (0m) 5 4 buy · 1 hold · 0 sell
- Strong buy1
- Buy3
- Hold1
- Sell0
- Strong sell0
Next earnings
Consensus EPS estimate 0.00.
Financials — quick view
GFR Revenue — quarterly 194.74M
GFR Net income — quarterly 53.46M
GFR EPS — quarterly 0.43
Earnings
| Report date | Quarter ending | EPS estimate | EPS reported | Surprise | Surprise % |
|---|---|---|---|---|---|
| Nov 8, 2026 | Sep 30, 2026 | 0.105 | -0.11 | -0.21 | -204.76% |
| Aug 5, 2026 | Jun 30, 2026 | 0.01 | 0.31 | +0.30 | +3,000.00% |
| May 5, 2026 | Mar 31, 2026 | 0.05737 | -0.42 | -0.48 | -832.09% |
| Mar 12, 2026 | Dec 31, 2025 | 0.14 | -0.08 | -0.22 | -157.14% |
| Nov 3, 2025 | Sep 30, 2025 | 0.14 | -0.09 | -0.23 | -164.29% |
| Aug 6, 2025 | Jun 30, 2025 | 0.23 | 0.50 | +0.27 | +117.39% |
Upgrades / downgrades
| Date | Firm | Action | From | To |
|---|---|---|---|---|
| Jun 13, 2024 | BMO Capital | init | — | Outperform |
About Greenfire Resources Ltd.
Greenfire Resources Ltd., together with its subsidiaries, engages in the exploration, development, and operation of oil and gas properties in the Athabasca oil sands region of Alberta, Canada. The company's principal asset includes the Hangingstone Facilities which consist of the Expansion Asset and the Demo Asset located in south of Fort McMurray, Alberta. Greenfire Resources Ltd. is headquartered in Calgary, Canada.
- Sector
- Energy
- Industry
- Oil & Gas E&P
- Country
- Canada
- Website
- greenfireres.com
News
 Crude Oil Falls Over 3%; NRG Energy Shares Jump After Strong Q3 Results
 CNH Industrial, Planet Labs, Ferguson Enterprises And Other Big Stocks Moving Higher On Monday
 Greenfire Resources Q3 EPS $(0.11) Down From $(0.09) YoY, Sales $218.134M Up From $102.512M YoY
 Why Is Greenfire Resources Stock Skyrocketing Monday?
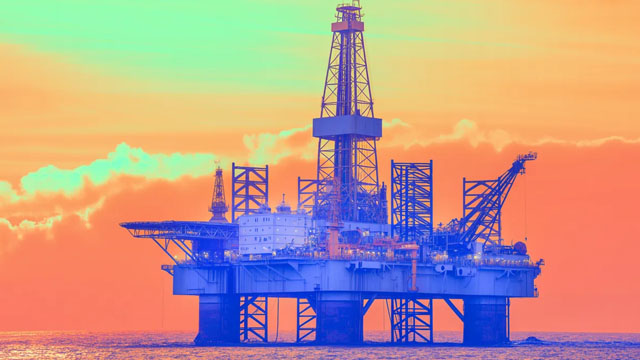 Why Greenfire Resources Shares Are Trading Higher By Over 25%; Here Are 20 Stocks Moving Premarket
 Why Greenfire Resources Shares Are Trading Higher By Over 25%; Here Are 20 Stocks Moving Premarket
 Greenfire Resources Reports Third Quarter 2026 Results and Provides an Operational Update
- Greenfire Resources Q2 EPS $0.31 Down From $0.50 YoY, Sales $129.597M Up From $104.422M YoY
 TriCo Bancshares, Verra Mobility, Park Aerospace And Other Big Stocks Moving Higher On Monday
 Greenfire Intends To Undertake Rights Offering In Connection With Proposed Acquisition Of Connacher Oil And Gas; Expects To Launch Rights Offering In August For Gross Proceeds Of At Least $575M
Your note
Sign in to keep a note on GFR — it syncs with the Stock Master app.
Institution ownership
| Holder | % held | Shares | Value | Reported |
|---|---|---|---|---|
| Moerus Capital Management, LLC | 0.93% | 2,232,277 | 17.28M | Jun 29, 2026 |
| Wexford Capital LP | 0.84% | 2,027,989 | 15.70M | Jun 29, 2026 |
| Nokomis Capital, L.l.c. | 0.67% | 1,612,581 | 12.48M | Jun 29, 2026 |
| Beverly Hills Private Wealth, LLC | 0.45% | 1,086,833 | 8.41M | Sep 29, 2026 |
| Aegis Financial Corporation | 0.32% | 777,716 | 6.02M | Jun 29, 2026 |
| K2 Principal Fund, L.P. | 0.30% | 720,740 | 5.58M | Jun 29, 2026 |
Fund ownership
| Holder | % held | Shares | Value | Reported |
|---|---|---|---|---|
| Fidelity Rutland Square TRT II-Strategic Advisers Fidelity U.S. Total | 1.81% | 4,357,400 | 33.73M | Sep 29, 2026 |
| Northern Lights Fund Trust IV-Moerus Worldwide Fund | 0.74% | 1,781,454 | 13.79M | Aug 30, 2026 |
| Fidelity Puritan Trust-Fidelity Balanced Fund | 0.38% | 923,589 | 7.15M | Sep 29, 2026 |
| Aegis Funds-Aegis Value Fund | 0.32% | 777,716 | 6.02M | Jul 30, 2026 |
| Fidelity Select Portfolios-Fidelity Natural Resources Fund | 0.29% | 696,700 | 5.39M | Sep 29, 2026 |
| Fidelity Capital Trust-Fidelity Stock Selector Fund | 0.10% | 247,104 | 1.91M | Sep 29, 2026 |