

Global X U.S. Cash Flow Kings 100 ETF FLOW
45.56 USD -0.67 (-1.44%)
At closeNov 3, 2026, 4:10 PM EST
45.56 0.00 0.00%
After hours · Nov 3, 4:10 PM ET
45.56 Day range 45.86
33.29 52-week range 46.48
- YTD
- +26.44%
- 1 year
- +32.24%
- Market cap
- 36.51M
- EPS (ttm)
- 3.08
- P/E ratio
- 14.77
- YTD return
- +26.44%
- 1-year return
- +32.24%
- Volume
- 4.79K
- Avg volume
- 4.23K
- Open
- 45.80
- Previous close
- 46.22
- Day's range
- 45.56 – 45.86
- 52-week range
- 33.29 – 46.48
- Earnings date
- May 4, 2022
2Y +13.73 (+43.14%)
Key statistics
- Enterprise value
- 0
- PEG ratio
- 0.00
- Price / sales
- 0.00
- Price / book
- 0.00
- Dividend yield
- 0.00%
- Payout ratio
- 0.00%
- Short % of float
- 0.00%
- 50-day average
- 32.60
- 200-day average
- 31.17
Next earnings
May 4, 2022
Expected May 4, 2022. Consensus EPS estimate 0.76.
Earnings
| Report date | Quarter ending | EPS estimate | EPS reported | Surprise | Surprise % |
|---|---|---|---|---|---|
| May 4, 2022 | Mar 1, 2022 | 0.76 | — | — | — |
| Feb 16, 2022 | Dec 1, 2021 | 0.94 | — | — | — |
| Nov 10, 2021 | Sep 1, 2021 | 0.69 | — | — | — |
| Aug 4, 2021 | Jun 1, 2021 | 0.59 | — | — | — |
| May 5, 2021 | Mar 1, 2021 | 0.33 | — | — | — |
| Feb 10, 2021 | Dec 1, 2020 | 0.36 | — | — | — |
About Global X U.S. Cash Flow Kings 100 ETF
The fund invests at least 80% of its net assets, plus the amount of any borrowings for investment purposes (if any), in the securities of the underlying index. The underlying index is designed to provide exposure to large- and mid-capitalization U.S. equity securities that exhibit high free cash flow yields relative to the eligible universe of companies, as determined by the index administrator. The fund is non-diversified.
News
 Tough Time Ahead for U.S. Stocks? ETF Areas That Could Stay Strong
 Tap Cash-Rich Stocks & ETFs to Weather Rising Bond Yields
 Flow Traders 3Q 2026 Pre-Close Call
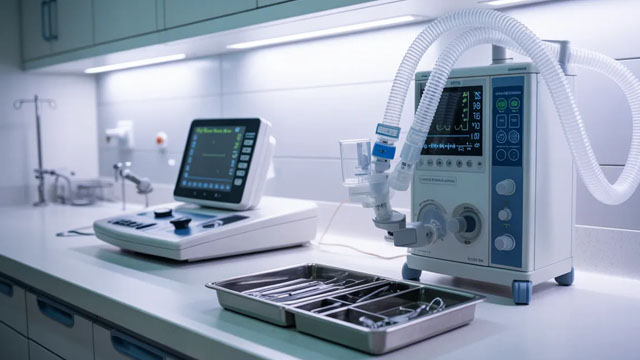 Smith+Nephew Launches FLOW FLEXTEND COBLATION Wand for Hip Surgery
 Smith+Nephew's new FLOW FLEXTEND™ COBLATION™ Wand improves access¹* and resection efficiency²** for complex hip procedures vs. fixed-angle options
 FLOW Cryptocurrency Investor News: If You Have Suffered Losses in FLOW Cryptocurrency, You Are Encouraged to Contact The Rosen Law Firm About Your Rights
 FLOW Cryptocurrency Investor News: If You Have Suffered Losses in FLOW Cryptocurrency, You Are Encouraged to Contact The Rosen Law Firm About Your Rights
 FLOW Cryptocurrency Investor News: If You Have Suffered Losses in FLOW Cryptocurrency, You Are Encouraged to Contact The Rosen Law Firm About Your Rights
 Flow Traders appoints Frank Drouet as CEO Asia-Pacific to support regional expansion
 Flow Traders 1Q 2026 Pre-Close Call
Your note
Sign in to keep a note on FLOW — it syncs with the Stock Master app.