

Ellomay Capital Ltd. ELLO
Nov 3, 2026, 3:32 PM EST
- YTD
- -18.52%
- 1 year
- -5.49%
- Market cap
- 272.91M
- Revenue (ttm)
- 43.29M
- Profit margin
- -10.84%
- EPS (ttm)
- -2.01
- Shares out
- 12.85M
- YTD return
- -18.52%
- 1-year return
- -5.49%
- Volume
- 5.96K
- Avg volume
- 2.19K
- Open
- 19.99
- Previous close
- 20.60
- Day's range
- 19.57 – 19.99
- 52-week range
- 17.50 – 30.34
- Beta
- 1.24
- Earnings date
- Jan 7, 2025
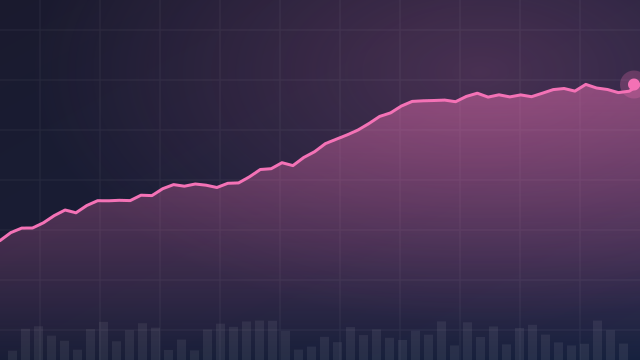
2Y +5.90 (+42.45%)
Key statistics
- Enterprise value
- 649.88M
- PEG ratio
- 0.00
- Price / sales
- 4.76
- Price / book
- 1.90
- Dividend yield
- 0.00%
- Payout ratio
- 0.00%
- Revenue growth
- -15.50%
- Free cash flow
- -38.04M
- Total cash
- 58.53M
- Total debt
- 467.56M
- Return on equity
- -4.53%
- Short % of float
- 0.02%
- 50-day average
- 14.61
- 200-day average
- 13.92
Next earnings
Jan 7, 2025
Expected Jan 7, 2025. Consensus EPS estimate 0.00.
Financials — quick view
Earnings
| Report date | Quarter ending | EPS estimate | EPS reported | Surprise | Surprise % |
|---|---|---|---|---|---|
| Jan 7, 2025 | Sep 1, 2024 | 0.00 | — | — | — |
| Sep 30, 2024 | Jun 1, 2024 | 0.00 | 0.03 | — | — |
| Jun 30, 2024 | Mar 1, 2024 | 0.00 | -0.34 | — | — |
| Mar 31, 2024 | Dec 1, 2023 | 0.00 | -0.56 | — | — |
| Jan 2, 2024 | Sep 1, 2023 | 0.00 | 0.45 | — | — |
| Sep 28, 2023 | Jun 1, 2023 | 0.00 | 0.12 | — | — |
About Ellomay Capital Ltd.
Ellomay Capital Ltd., together with its subsidiaries, engages in the initiation, development, construction, and production of renewable and clean energy projects in Spain, the United States, Italy, the Netherlands, and Israel. The company owns photovoltaic (PV) plants comprising five PV plants in Spain with an aggregate installed capacity of approximately 35.9 megawatts (MW); and one PV plant with an installed capacity of 300 MW in the municipality of Talaván, Spain. It also operates a dual-fuel operated power plant with an installed capacity of approximately 850 MWp in the vicinity of Ashkelon, Israel; and constructs a 156 MW pumped storage hydro power plant in the Manara Cliff, Israel. In addition, the company operates anaerobic digestion plants with a green gas production capacity of approximately 3 million, 3.8 million, and 9.5 million Nm3 per year in the Netherlands. Further, it constructs and develops PV plants with installed capacity of 14.8 MW and 4.95 MW in Lazio, Italy; and PV projects with an installed capacity of 15.06 MW, 87.2 MW, 54.77 MW, 8 MW, and 18 MW in Italy, as well as with installed capacity of 13.44 MW, 6.96 MW, 6.96 MW, 5.2 MW, 5.2 MW, and 9.7 MW in the Dallas metropolitan area, Texas. The company was formerly known as NUR Macroprinters Ltd. and changed its name to Ellomay Capital Ltd. in April 2008. Ellomay Capital Ltd. was incorporated in 1987 and is headquartered in Tel Aviv, Israel.
- Sector
- Utilities
- Industry
- Utilities - Renewable
- Country
- Israel
- Website
- ellomay.com
News
 Ellomay Capital's Ellomay Solar Subsidiary Receives Battery Storage Grid Access And Connection Permit For 22.2 Megawatts Capacity Project
 Ellomay Announces Receipt of a 22.2 MW / 100.3 MWh (4.5-hour) Battery Storage Grid Access and Connection Permit by Ellomay Solar
 A Look at Ellomay Capital Ltd (ELLO) After 3.7% Gain -- GF Value $14.73 vs Price $21.00
 Ellomay Cap Q2 EPS $5.97 , Sales $14.158M
 Ellomay Capital Reports Results for the Three and Six Months Ended June 30, 2026
 Ellomay Enters the Italian Battery Storage Market with the Execution of an Agreement to Acquire a 51.75 MW / 207 MWh (4-hour) Project in Northern Italy
 Ellomay Cap Q1 EPS $(0.89) Down From $0.67 YoY, Sales $9.954M Up From $9.584M YoY
 Ellomay Capital Reports Results for the Three Months Ended March 31, 2026
 Ellomay Capital Consummates the Sale of its Indirect Holdings in Dorad Energy Ltd.
 Ellomay Capital Announces the Filing of the Annual Report on Form 20-F for 2025
Your note
Sign in to keep a note on ELLO — it syncs with the Stock Master app.
Institution ownership
| Holder | % held | Shares | Value | Reported |
|---|---|---|---|---|
| Clal Insurance Enterprises Holdings Ltd | 12.47% | 1,603,265 | 25.70M | Sep 29, 2024 |
| Phoenix Holdings Ltd. | 2.49% | 319,751 | 5.13M | Sep 29, 2024 |
| Yelin Lapidot Holdings Management Ltd. | 0.86% | 110,265 | 1.77M | Sep 29, 2024 |
| Y.D. More Investments Ltd | 0.15% | 18,744 | 300.47K | Sep 29, 2024 |
| JP Morgan Chase & Company | 0.01% | 1,425 | 22.84K | Sep 29, 2024 |
| Bank of America Corporation | 0.00% | 19 | 304 | Sep 29, 2024 |
Fund ownership
| Holder | % held | Shares | Value | Reported |
|---|---|---|---|---|
| DFA International Vector Equity Port | 0.02% | 2,696 | 43.22K | Jul 30, 2024 |
| DFA Continental Small Company Series | 0.02% | 2,597 | 41.63K | Jul 30, 2024 |
| DFA International Sustainability Core 1 Portfolio | 0.02% | 2,313 | 37.08K | Jul 30, 2024 |
| DFA International Core Equity Portfolio | 0.02% | 2,636 | 42.26K | Jul 30, 2024 |
| Dimensional ETF Tr-Dimensional International Core Equity 2 ETF | 0.01% | 820 | 13.14K | Jul 30, 2024 |
| DFA Investment Dimensions-DFA International Social Core Equity Port | 0.00% | 460 | 7.37K | Jul 30, 2024 |