

Chemring Group PLC CMGMF
6.75 USD 0.00 (+0.00%)
Regular-session close
7.20 Day range 7.20
5.95 52-week range 8.59
- YTD
- +11.57%
- 1 year
- +3.21%
No chart data for this range yet.
- Market cap
- 1.83B
- EPS (ttm)
- 0.17
- P/E ratio
- 39.71
- YTD return
- +11.57%
- 1-year return
- +3.21%
- Volume
- 3.00K
- Avg volume
- 129
- Open
- 7.20
- Previous close
- 6.75
- Day's range
- 7.20 – 7.20
- 52-week range
- 5.95 – 8.59
Earnings
| Report date | Quarter ending | EPS estimate | EPS reported | Surprise | Surprise % |
|---|---|---|---|---|---|
| Jun 2, 2026 | Apr 30, 2026 | 0.08298 | 0.08298 | 0.00 | 0.00% |
| Dec 9, 2025 | Oct 31, 2025 | 0.1637 | 0.1324 | -0.03 | -19.12% |
| Jun 2, 2025 | Apr 30, 2025 | 0.08434 | 0.09815 | +0.01 | +16.37% |
| Dec 17, 2024 | Oct 31, 2024 | 0.1644 | 0.1269 | -0.04 | -22.81% |
| Jun 4, 2024 | Apr 30, 2024 | 0.09988 | 0.05462 | -0.05 | -45.31% |
| Feb 23, 2024 | Oct 31, 2023 | 0.1555 | -0.05838 | -0.21 | -137.54% |
News
 Palliser Capital Calls on Chemring Board to Launch Comprehensive Strategic Review
 Palliser Capital builds stake in UK's Chemring and pushes for break-up, FT reports
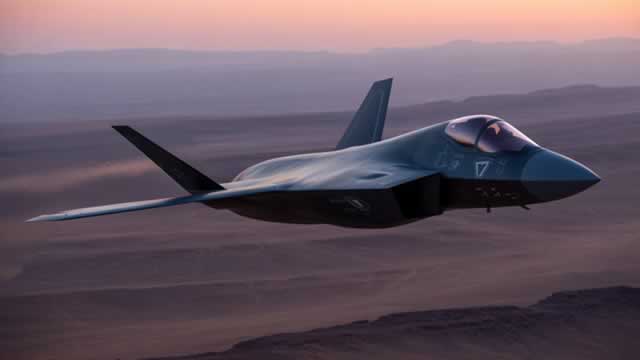 Chemring shares jump 4% after Roke lands $170 million US defence deal
 Defence sector rallies as Starmer confirms more spending on drones and nuclear deterrent
 Chemring wins $345m of contracts with US Dept of War for airborne countermeasures
 Chemring Group PLC (CMGMY) Q2 2026 Earnings Call Transcript
 Chemring Group H1 Earnings Call Highlights
 Chemring maintains guidance despite first-half profit dip
 Chemring, Babcock and Avon top picks in defence sector, with BAE premium 'not justified'
 Chemring Group (OTCMKTS:CMGMF) Stock Price Up 0.4% – Still a Buy?
Your note
Sign in to keep a note on CMGMF — it syncs with the Stock Master app.