

CAVA Group, Inc. CAVA
58.23 USD +0.88 (+1.53%)
Regular-session close
58.45 +0.22 +0.38%
After hours · Nov 13, 6:32 PM ET
56.75 Day range 58.25
43.41 52-week range 98.79
- YTD
- -0.78%
- 1 year
- +20.81%
- Market cap
- 6.80B
- Revenue (ttm)
- 1.44B
- Profit margin
- 4.50%
- EPS (ttm)
- 0.55
- Shares out
- 116.84M
- P/E ratio
- 105.87
- Forward P/E
- 82.14
- YTD return
- -0.78%
- 1-year return
- +20.81%
- Volume
- 2.51M
- Avg volume
- 3.26M
- Open
- 56.80
- Previous close
- 57.35
- Day's range
- 56.75 – 58.25
- 52-week range
- 43.41 – 98.79
- Beta
- 1.76
- Analysts
- Buy
- Price target
- 75.42 (+29.5%)
- Earnings date
- Feb 23, 2027
5D -1.73 (-2.89%)
Key statistics
- Enterprise value
- 6.81B
- PEG ratio
- 5.16
- Price / sales
- 4.73
- Price / book
- 7.92
- Dividend yield
- 0.00%
- Payout ratio
- 0.00%
- Revenue growth
- 22.00%
- Free cash flow
- -9.41M
- Total cash
- 427.87M
- Total debt
- 536.90M
- Return on equity
- 7.95%
- Short % of float
- 14.32%
- 50-day average
- 55.42
- 200-day average
- 71.25
Fundamental scorecard
11 of 25 checks passed on CAVA’s reported financials
11of 25 checks passed
- Value 3 of 5
- Growth 2 of 5
- Profitability 2 of 5
- Financial health 4 of 5
- Dividend 0 of 5
Statements to Oct 4, 2026.
Analyst view
Consensus: buy
Buy
Price target (mean) 75.42 +29.5% upside
Now 58.23
- Target (low)
- 18.00
- Target (mean)
- 75.42
- Target (high)
- 110.00
Ratings (0m) 27 19 buy · 7 hold · 1 sell
- Strong buy3
- Buy16
- Hold7
- Sell1
- Strong sell0
Next earnings
Feb 23, 2027
Expected Feb 23, 2027. Consensus EPS estimate 0.0192.
Financials — quick view
CAVA Revenue — quarterly 356.44M
CAVA Net income — quarterly 13.20M
CAVA EPS — quarterly 0.11
Earnings
| Report date | Quarter ending | EPS estimate | EPS reported | Surprise | Surprise % |
|---|---|---|---|---|---|
| Feb 23, 2027 | Jan 4, 2027 | 0.03 | — | — | — |
| Nov 4, 2026 | Oct 4, 2026 | 0.1194 | 0.11 | -0.01 | -7.87% |
| Aug 11, 2026 | Jul 12, 2026 | 0.1836 | 0.19 | +0.01 | +3.49% |
| May 19, 2026 | Apr 19, 2026 | 0.17 | 0.20 | +0.03 | +17.65% |
| Feb 24, 2026 | Dec 28, 2025 | 0.03 | 0.04 | +0.01 | +33.33% |
| Nov 4, 2025 | Oct 5, 2025 | 0.13 | 0.12 | -0.01 | -7.69% |
Upgrades / downgrades
| Date | Firm | Action | From | To |
|---|---|---|---|---|
| Nov 9, 2026 | Mizuho | main | Neutral | Neutral |
| Nov 6, 2026 | Citigroup | main | Neutral | Neutral |
| Nov 5, 2026 | Telsey Advisory Group | main | Outperform | Outperform |
| Nov 5, 2026 | RBC Capital | main | Outperform | Outperform |
| Nov 5, 2026 | BNP Paribas | main | Neutral | Neutral |
| Nov 5, 2026 | Bernstein | main | Outperform | Outperform |
About CAVA Group, Inc.
CAVA Group, Inc. owns and operates a chain of restaurants under the CAVA brand in the United States. It also offers dips, spreads, and dressings through grocery stores. In addition, the company provides walk-the-line, online, and mobile ordering platforms. CAVA Group, Inc. was founded in 2006 and is headquartered in Washington, District Of Columbia.
- Sector
- Consumer Cyclical
- Industry
- Restaurants
- Country
- United States
- Website
- cava.com
News
 Dutch Bros vs. CAVA: Which Stock Is a Better Buy for 2027?
 CAVA vs. Hershey: Which Stock Is a Better Buy for 2027?
 4 Consumer Discretionary Stocks With Whale Alerts In Today’s Session
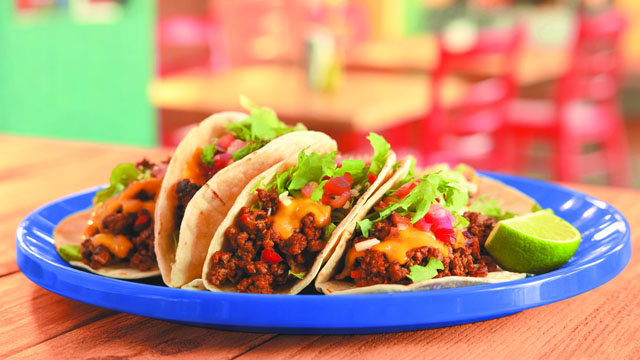 Investors Heavily Search CAVA Group, Inc. (CAVA): Here is What You Need to Know
 CAVA Group: High Valuation And Underwhelming Earnings Force A Downgrade
 Cava vs. Chipotle Mexican Grill: Which Stock Is a Better Buy?
 5 Stocks For Option Trading This Month
 5 Stocks For Option Trading This Month
 Mizuho Maintains Neutral on Cava Group, Lowers Price Target to $54
 Citigroup Maintains Neutral on Cava Group, Lowers Price Target to $65
Your note
Sign in to keep a note on CAVA — it syncs with the Stock Master app.
Insider holders
| Insider | Relation | Latest transaction | Date | Shares held |
|---|---|---|---|---|
| ARTAL INTERNATIONAL S.C.A. | Unknown | Sale | Nov 17, 2024 | 0 |
| ARTAL PARTICIPATIONS S.A.R.L. | Unknown | Sale | Jun 14, 2026 | 0 |
| BERTRAM KENNETH ROBERT | Officer | Sale | Mar 4, 2026 | 39,653 |
| BOSSERMAN DAVID | Director | Stock Award(Grant) | Jun 21, 2026 | 145,918 |
| COSTANZA KELLY | Officer | Sale | Jun 16, 2026 | 98,490 |
| SCHULMAN BRETT M | Chief Executive Officer | Sale | Jun 14, 2026 | 1,539,020 |
Institution ownership
| Holder | % held | Shares | Value | Reported |
|---|---|---|---|---|
| Blackrock Inc. | 8.26% | 9,645,932 | 561.88M | Jun 29, 2026 |
| Alliancebernstein L.P. | 5.69% | 6,642,936 | 386.95M | Jun 29, 2026 |
| Artal Group S.A. | 5.57% | 6,507,990 | 379.09M | Jun 29, 2026 |
| FMR, LLC | 4.73% | 5,528,752 | 322.05M | Jun 29, 2026 |
| Vanguard Capital Management LLC | 3.84% | 4,486,095 | 261.32M | Jun 29, 2026 |
| Vanguard Portfolio Management LLC | 3.61% | 4,213,225 | 245.42M | Jun 29, 2026 |
Fund ownership
| Holder | % held | Shares | Value | Reported |
|---|---|---|---|---|
| SmallCap World Fund Inc | 3.50% | 4,093,262 | 238.43M | Sep 29, 2026 |
| iShares Trust-iShares Core S&P Mid-Cap ETF | 3.17% | 3,704,071 | 215.76M | Sep 29, 2026 |
| VANGUARD INDEX FUNDS-Vanguard Total Stock Market Index Fund | 2.69% | 3,145,286 | 183.21M | Jun 29, 2026 |
| VANGUARD INDEX FUNDS-Vanguard Small-Cap Index Fund | 1.94% | 2,271,180 | 132.30M | Jun 29, 2026 |
| AB Large Cap Growth Fund Inc | 1.26% | 1,477,886 | 86.09M | Sep 29, 2026 |
| VANGUARD INDEX FUNDS-Vanguard Small-Cap Growth Index Fund | 1.12% | 1,308,132 | 76.20M | Jun 29, 2026 |