

Berkshire Hathaway Inc. BRK-B
Regular-session close
After hours · Nov 17, 4:39 PM ET
- YTD
- +16.73%
- 1 year
- +15.29%
- Market cap
- 1.25T
- Revenue (ttm)
- 395.36B
- Profit margin
- 19.50%
- EPS (ttm)
- 35.73
- Shares out
- 1.40B
- P/E ratio
- 16.42
- Forward P/E
- 25.73
- YTD return
- +16.73%
- 1-year return
- +15.29%
- 50-day average
- 531.39
- Volume
- 5.04M
- Avg volume
- 4.61M
- Open
- 589.98
- Previous close
- 592.85
- Day's range
- 586.04 – 592.01
- 52-week range
- 464.01 – 596.92
- Beta
- 0.57
- Analysts
- Buy
- Price target
- 564.67 (-3.8%)
- Earnings date
- Feb 22, 2027
5D +9.97 (+1.72%)
Key statistics
- 200-day average
- 501.00
- Enterprise value
- -243.55B
- PEG ratio
- 10.06
- Price / sales
- 3.15
- Price / book
- 0.00
- Revenue growth
- 11.20%
- Free cash flow
- 52.47B
- Total cash
- 377.43B
- Total debt
- 130.78B
- Return on equity
- 10.57%
- Short % of float
- 0.99%
Analyst view
Consensus: buy
- Target (low)
- 510.00
- Target (mean)
- 564.67
- Target (high)
- 628.00
- Strong buy0
- Buy2
- Hold1
- Sell0
- Strong sell1
Next earnings
Feb 22, 2027
Expected Feb 22, 2027. Consensus EPS estimate 6.14.
Earnings
| Report date | Quarter ending | EPS estimate | EPS reported | Surprise | Surprise % |
|---|---|---|---|---|---|
| Feb 22, 2027 | Dec 30, 2026 | 5.38 | — | — | — |
| Nov 7, 2026 | Sep 30, 2026 | 5.91 | 10.33 | +4.42 | +74.79% |
| Aug 8, 2026 | Jun 30, 2026 | 5.13 | 6.02 | +0.89 | +17.35% |
| May 2, 2026 | Mar 31, 2026 | 5.08 | 5.25 | +0.17 | +3.35% |
| Mar 2, 2026 | Dec 31, 2025 | 5.51 | 4.73 | -0.78 | -14.16% |
| Nov 3, 2025 | Sep 30, 2025 | 5.72 | 14.28 | +8.56 | +149.65% |
Upgrades / downgrades
| Date | Firm | Action | From | To |
|---|---|---|---|---|
| Oct 22, 2026 | UBS | main | Buy | Buy |
| Aug 10, 2026 | UBS | main | Buy | Buy |
| Jul 28, 2026 | UBS | main | Buy | Buy |
| May 4, 2026 | UBS | main | Buy | Buy |
| Nov 3, 2025 | UBS | main | Buy | Buy |
| Oct 15, 2025 | UBS | main | Buy | Buy |
About Berkshire Hathaway Inc.
Berkshire Hathaway Inc., together with its subsidiaries, engages in the insurance, freight rail transportation, and utility businesses. The company provides property, casualty, life, accident, and health insurance and reinsurance; operates railroad systems in North America; generates, transmits, stores, and distributes electricity from natural gas, coal, wind, solar, hydroelectric, nuclear, and geothermal sources; operates natural gas distribution and storage facilities, interstate pipelines, liquefied natural gas facilities, and compressor and meter stations; and holds interest in coal mining assets. It manufactures boxed chocolates and other confectionery products; specialty chemicals, metal cutting tools, and components for aerospace and power generation applications; prefabricated and site-built residential homes, flooring products; insulation, roofing, and engineered products; building and engineered components; paints and coatings; and bricks and masonry products, as well as offers manufactured and site-built home construction, and related lending and financial services. In addition, the company provides recreational vehicles, apparel, footwear, toys, jewelry, custom picture framing products, alkaline batteries, logistics services, and professional aviation training and shared aircraft ownership programs; castings, forgings, fasteners/fastener systems, aerostructures, and precision components; and cobalt, nickel, and titanium alloys. Further, it distributes televisions and information, and grocery and non-food consumer products; franchises and services quick service restaurants; and distributes electronic components. Additionally, it retails automobiles; furniture, bedding, and accessories; household appliances, electronics, and floor coverings; watches, home decor and repair services; sells kitchenware; and motorcycle clothing and equipment. The company was incorporated in 1998 and is headquartered in Omaha, Nebraska.
- Sector
- Financial Services
- Industry
- Insurance - Diversified
- Country
- United States
- Website
- berkshirehathaway.com
News
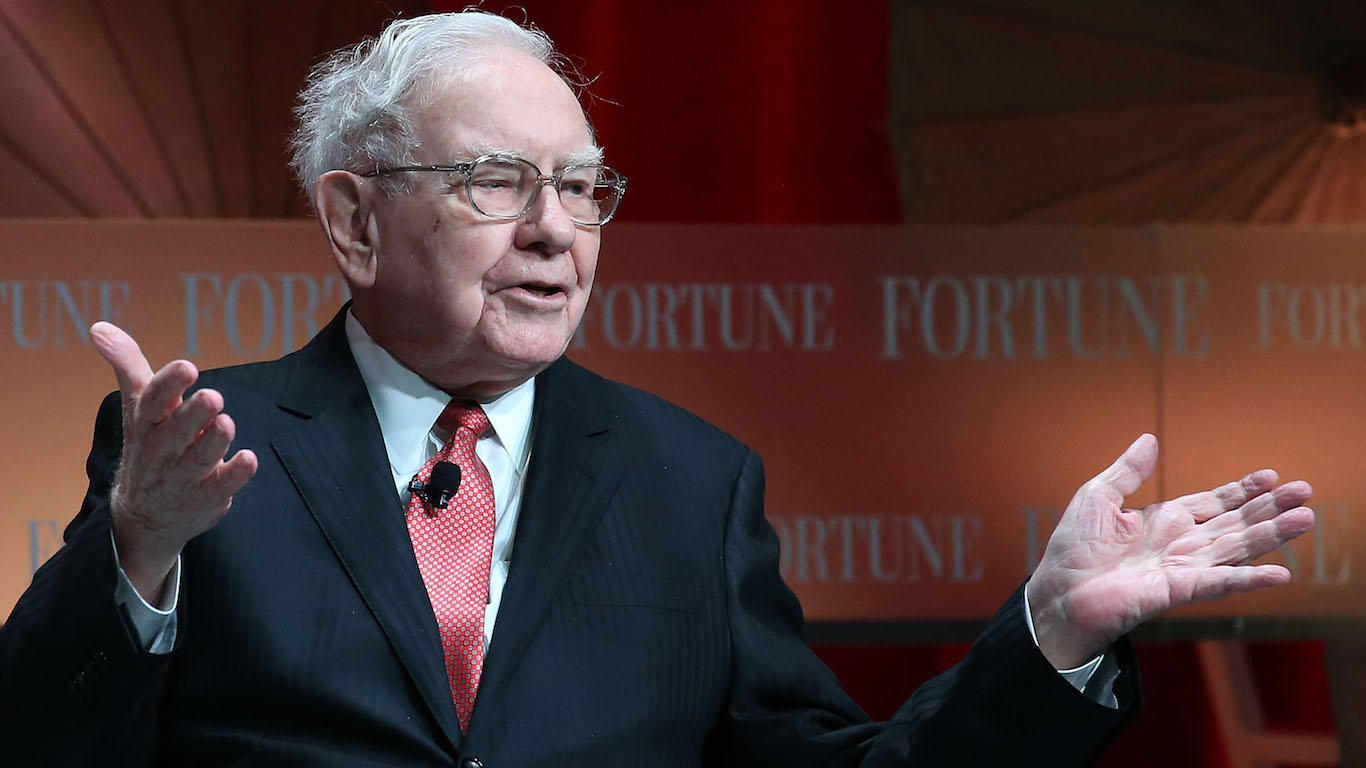 Warren Buffett’s Berkshire Just Hit a Record High as Nvidia Sank. A 67-Year-Old Who Bought 1,000 Shares in 2016 Can Sell $106,000 of It This Year and Pay 0% on the Gain
 Warren Buffett's Berkshire Compounded at More Than 19% a Year Over Six Decades, Nearly Double the S&P 500's 10% Return. Can Investors Still Apply That Playbook Today?
 Warren Buffett Said This 1 Mistake Cost Berkshire About $10 Billion. Here's How Investors Can Avoid It.
 Berkshire breaks out to record high with fourth-quarter rally reaching 19%
 Berkshire Hathaway Laid The Blueprint For Right Capital Empire
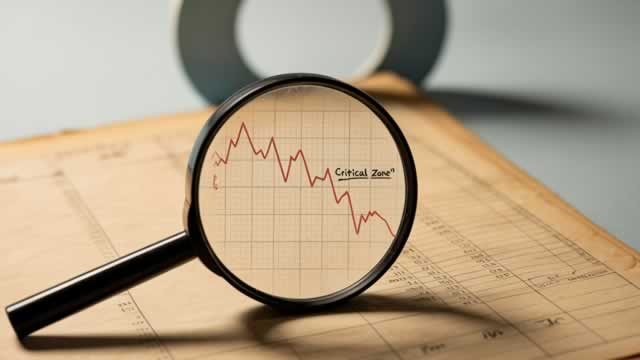 Berkshire vs. Travelers: Which Insurance Stock Has More Upside?
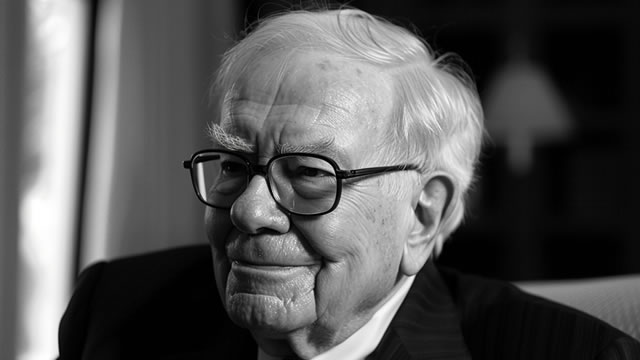 Forget the "Magnificent Seven." Berkshire Hathaway Could Be the Better Long-Term Bet.
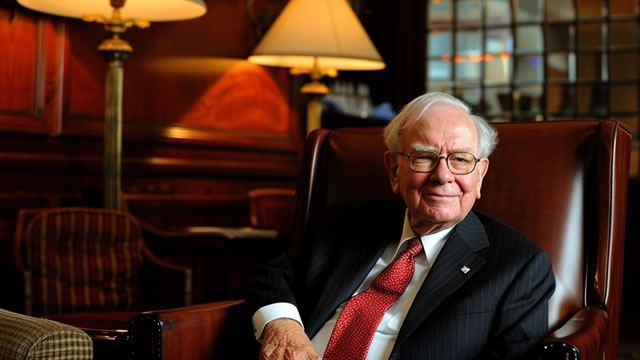 Berkshire Hathaway's Greg Abel Bought Back a Record $9.6 Billion of Stock Last Quarter. Here's Why That Pace Might Not Continue.
 Zaragoza Realty Group of Berkshire Hathaway HomeServices California Properties Lists Historic “Crown Jewel of Coronado” for $39 Million
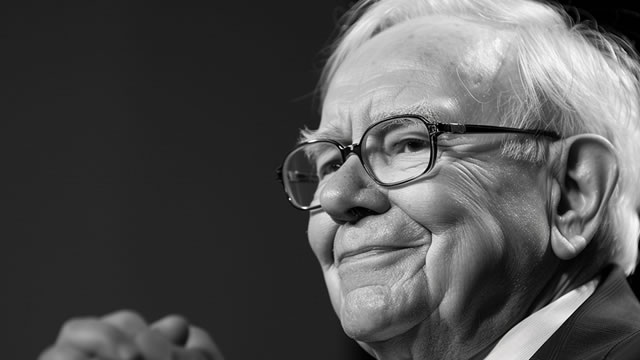 Warren Buffett's Successor, Greg Abel, Has Over 35% of Berkshire Hathaway's $359 Billion Portfolio Invested in Just 2 Undeniable Winners
Your note
Sign in to keep a note on BRK-B — it syncs with the Stock Master app.
Insider holders
| Insider | Relation | Latest transaction | Date | Shares held |
|---|---|---|---|---|
| BUFFETT WARREN E | Director and Beneficial Owner of more than 10% of a Class of Security | Conversion of Exercise of derivative security | Jul 13, 2026 | 1,162 |
| GUYMAN CHARLOTTE M | Director | Stock Gift | May 13, 2026 | 2,888 |
| JAIN AJIT | Officer and Director | Sale | Sep 27, 2026 | 0 |
| O'SULLIVAN MICHAEL J | General Counsel | Purchase | Nov 11, 2026 | 0 |
| WITMER MERYL B | Director | Stock Gift | Feb 23, 2025 | 1,000 |
Institution ownership
| Holder | % held | Shares | Value | Reported |
|---|---|---|---|---|
| Blackrock Inc. | 8.76% | 122,983,392 | 72.20B | Sep 29, 2026 |
| Vanguard Capital Management LLC | 8.48% | 119,016,252 | 69.87B | Sep 29, 2026 |
| State Street Corporation | 5.51% | 77,279,572 | 45.37B | Sep 29, 2026 |
| Geode Capital Management, LLC | 3.04% | 42,631,638 | 25.03B | Sep 29, 2026 |
| Morgan Stanley | 1.96% | 27,492,470 | 16.14B | Sep 29, 2026 |
| Vanguard Portfolio Management LLC | 1.74% | 24,395,682 | 14.32B | Sep 29, 2026 |
Fund ownership
| Holder | % held | Shares | Value | Reported |
|---|---|---|---|---|
| VANGUARD INDEX FUNDS-Vanguard Total Stock Market Index Fund | 4.07% | 57,128,626 | 33.54B | Jun 29, 2026 |
| VANGUARD INDEX FUNDS-Vanguard 500 Index Fund | 3.38% | 47,507,735 | 27.89B | Jun 29, 2026 |
| iShares Trust-iShares Core S&P 500 ETF | 1.77% | 24,816,638 | 14.57B | Sep 29, 2026 |
| Fidelity Concord Street Trust-Fidelity 500 Index Fund | 1.72% | 24,203,899 | 14.21B | Sep 29, 2026 |
| SPDR S&P 500 ETF TRUST-State Street SPDR S&P 500 ETF Trust | 1.64% | 23,042,322 | 13.53B | Sep 29, 2026 |
| VANGUARD INDEX FUNDS-Vanguard Value Index Fund | 1.07% | 14,985,762 | 8.80B | Jun 29, 2026 |