

Biglari Holdings Inc. BH
At closeNov 9, 2026, 7:29 PM EST
After hours · Nov 9, 7:29 PM ET
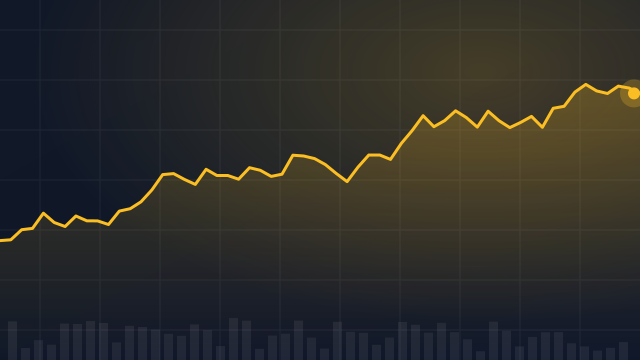
- YTD
- +12.37%
- 1 year
- +3.76%
- Market cap
- 1.19B
- Revenue (ttm)
- 417.94M
- Profit margin
- -5.61%
- EPS (ttm)
- -22.74
- Shares out
- 2.11M
- Forward P/E
- -50.26
- YTD return
- +12.37%
- 1-year return
- +3.76%
- Volume
- 90.66K
- Avg volume
- 125.38K
- Open
- 329.52
- Previous close
- 322.43
- Day's range
- 323.05 – 374.54
- 52-week range
- 234.92 – 483.60
- Beta
- 0.49
Key statistics
- Enterprise value
- 181.17M
- PEG ratio
- -18.80
- Price / sales
- 2.85
- Price / book
- 0.41
- Dividend yield
- 0.00%
- Payout ratio
- 0.00%
- Revenue growth
- 12.40%
- Free cash flow
- -1.27M
- Total cash
- 368.91M
- Total debt
- 337.21M
- Return on equity
- -3.99%
- Short % of float
- 3.64%
- 50-day average
- 373.94
- 200-day average
- 354.73
Next earnings
Consensus EPS estimate 0.00.
Financials — quick view
Earnings
| Report date | Quarter ending | EPS estimate | EPS reported | Surprise | Surprise % |
|---|---|---|---|---|---|
| Aug 7, 2026 | Jun 30, 2026 | — | 158.17 | — | — |
| May 8, 2026 | Mar 31, 2026 | — | -0.5589 | — | — |
| Feb 28, 2026 | Dec 31, 2025 | — | -2.38 | — | — |
| Nov 7, 2025 | Sep 30, 2025 | -4.15 | 23.46 | +27.61 | +665.30% |
| Aug 8, 2025 | Jun 30, 2025 | -3.65 | 9.17 | +12.82 | +351.23% |
| May 9, 2025 | Mar 31, 2025 | -1.77 | 23.37 | +25.14 | +1,420.34% |
Upgrades / downgrades
| Date | Firm | Action | From | To |
|---|---|---|---|---|
| Jan 31, 2017 | CL King | down | Buy | Neutral |
| Jun 13, 2013 | Societe Generale | up | Hold | Buy |
About Biglari Holdings Inc.
Biglari Holdings Inc., through its subsidiaries, primarily operates and franchises restaurants in the United States. The company owns, operates, and franchises restaurants under the Steak n Shake and Western Sizzlin names. It also engages in underwriting commercial truck insurance, including selling physical damage and non-trucking liability insurance to truckers; and property and casualty insurance and reinsurance. In addition, the company operates oil and natural gas properties offshore in Louisiana state waters and in the Permian Basin; and publishes, licenses, and sells magazines under the MAXIM brand names. Further, it involved investment activities. The company was formerly known as The Steak n Shake Company and changed its name to Biglari Holdings Inc. in April 2010. Biglari Holdings Inc. was founded in 1934 and is based in San Antonio, Texas.
- Sector
- Consumer Cyclical
- Industry
- Restaurants
- Country
- United States
- Website
- biglariholdings.com
News
 Top 3 Consumer Stocks That May Fall Off A Cliff In June
 Crude Oil Gains 3%; Constellation Energy Posts Upbeat Earnings
 12 Consumer Discretionary Stocks Moving In Monday's Intraday Session
 Biglari Holdings Q1 EPS $(55.81) Up From $(126.40) YoY, Sales $97.481M Up From $95.035M YoY
 Steak 'n Shake Says It's Paying Hourly Employees A Bitcoin Bonus For Every Hour Worked, Pledges Trump Account Contributions
 Steak 'N Shake Says Bitcoin Caused Sales To Rise 'Dramatically' And The Coins Are Flowing To Strategic Reserve That Funds Staff Bonuses
 Burger-To-Bitcoin: Fast Food Chain Steak 'N Shake Ups BTC Exposure By $5 Million
 Bitcoin Bonuses To Sell Burgers? This Restaurant Company Will Pay You BTC For Each Hour Worked
 Bitcoin Bonuses: Steak 'N Shake Announces Latest Perk For Hourly Workers
 RFK Jr's Food Pyramid Could Mean Family Grocery Bills Of $36,400 A Year: Stocks Poised To Win Or Lose
Your note
Sign in to keep a note on BH — it syncs with the Stock Master app.
Insider holders
| Insider | Relation | Latest transaction | Date | Shares held |
|---|---|---|---|---|
| BIGLARI SARDAR | Chief Executive Officer | Purchase | Jun 4, 2026 | 0 |
Institution ownership
| Holder | % held | Shares | Value | Reported |
|---|---|---|---|---|
| Biglari Capital Corp. | 69.71% | 1,472,237 | 551.26M | Jun 29, 2026 |
| Dimensional Fund Advisors LP | 4.23% | 89,292 | 33.43M | Sep 29, 2026 |
| Two Sigma Investments, LP | 2.40% | 50,618 | 18.95M | Jun 29, 2026 |
| Blackrock Inc. | 2.18% | 46,135 | 17.27M | Jun 29, 2026 |
| Marshall Wace LLP | 1.47% | 31,016 | 11.61M | Jun 29, 2026 |
| Renaissance Technologies, LLC | 1.36% | 28,627 | 10.72M | Jun 29, 2026 |
Fund ownership
| Holder | % held | Shares | Value | Reported |
|---|---|---|---|---|
| VANGUARD INDEX FUNDS-Vanguard Total Stock Market Index Fund | 0.96% | 20,257 | 7.59M | Jun 29, 2026 |
| iShares Trust-iShares Russell 2000 ETF | 0.90% | 18,913 | 7.08M | Sep 29, 2026 |
| DFA INVESTMENT DIMENSIONS GROUP INC-U.S. Targeted Value Portfolio | 0.73% | 15,476 | 5.79M | Jul 30, 2026 |
| DFA INVESTMENT DIMENSIONS GROUP INC-U.S. Small Cap Value Portfolio | 0.68% | 14,456 | 5.41M | Jul 30, 2026 |
| Dimensional ETF Trust-Dimensional U.S. Targeted Value ETF | 0.56% | 11,764 | 4.40M | Jul 30, 2026 |
| DFA INVESTMENT DIMENSIONS GROUP INC-U.S. Small Cap Portfolio | 0.53% | 11,213 | 4.20M | Jul 30, 2026 |