

B&G Foods, Inc. BGS
As ofNov 20, 2026, 1:58 PM EST
- YTD
- -15.47%
- 1 year
- -14.47%
5D +0.24 (+7.00%)
- Market cap
- 294.95M
- Revenue (ttm)
- 1.96B
- Profit margin
- -1.34%
- EPS (ttm)
- -1.04
- Shares out
- 79.16M
- Forward P/E
- 10.44
- Dividend
- 0.76 (10.35%)
- Ex-dividend date
- Dec 31, 2024
- YTD return
- -15.47%
- 1-year return
- -14.47%
- Volume
- 1.65M
- Avg volume
- 2.40M
- Open
- 3.59
- Previous close
- 3.36
- Day's range
- 3.56 – 3.72
- 52-week range
- 1.99 – 6.38
- Beta
- 0.66
- Analysts
- Underperform
- Price target
- 8.07 (+122.0%)
- 50-day average
- 7.43
Key statistics
- 200-day average
- 8.83
- Enterprise value
- 2.66B
- Price / sales
- 0.29
- Price / book
- 0.74
- Payout ratio
- 333.33%
- Revenue growth
- -8.30%
- Free cash flow
- 190.96M
- Total cash
- 54.69M
- Total debt
- 2.14B
- Return on equity
- -3.29%
- Short % of float
- 18.80%
Fundamental scorecard
8 of 25 checks passed on BGS’s reported financials
8of 25 checks passed
- Value 3 of 5
- Growth 1 of 5
- Profitability 0 of 5
- Financial health 1 of 5
- Dividend 3 of 5
Statements to Oct 3, 2026.
Financials — quick view
Earnings
| Report date | Quarter ending | EPS estimate | EPS reported | Surprise | Surprise % |
|---|---|---|---|---|---|
| Nov 5, 2024 | Sep 1, 2024 | 0.20 | 0.13 | -0.07 | -35.00% |
| Aug 6, 2024 | Jun 1, 2024 | 0.08 | 0.08 | 0.00 | 0.00% |
| May 8, 2024 | Mar 1, 2024 | 0.20 | 0.18 | -0.02 | -10.00% |
| Feb 27, 2024 | Dec 1, 2023 | 0.28 | 0.30 | +0.02 | +7.14% |
| Nov 8, 2023 | Sep 1, 2023 | 0.23 | 0.27 | +0.04 | +17.39% |
| Aug 3, 2023 | Jun 1, 2023 | 0.09 | 0.15 | +0.06 | +66.67% |
Upgrades / downgrades
| Date | Firm | Action | From | To |
|---|---|---|---|---|
| Nov 7, 2024 | Barclays | main | Equal-Weight | Equal-Weight |
| Nov 6, 2024 | TD Cowen | main | Sell | Sell |
| Nov 6, 2024 | Evercore ISI Group | main | In-Line | In-Line |
| Aug 7, 2024 | RBC Capital | reit | Sector Perform | Sector Perform |
| Jul 19, 2024 | Barclays | main | Equal-Weight | Equal-Weight |
| Jul 11, 2024 | Piper Sandler | main | Neutral | Neutral |
About B&G Foods, Inc.
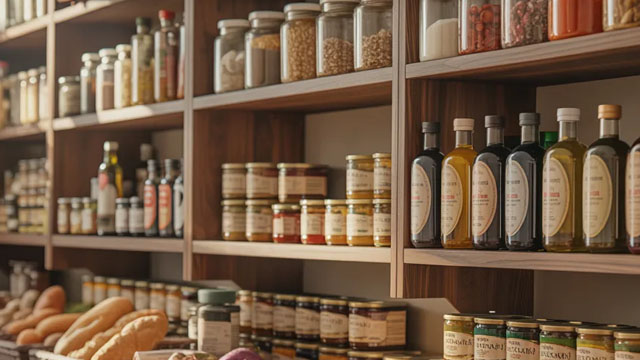
B&G Foods, Inc. manufactures, sells, and distributes a portfolio of shelf-stable and frozen foods, and household products in the United States, Canada, and Puerto Rico. The company's products include frozen and canned vegetables, vegetables, canola and other cooking oils, vegetable shortening, cooking sprays, oatmeal and other hot cereals, fruit spreads, canned meats and beans, bagel chips, spices, seasonings, hot sauces, wine vinegar, maple syrups, molasses, salad dressings, pizza crusts, Mexican-style sauces, dry soups, taco shells and kits, salsas, pickles, peppers, tomato-based products, crackers, baking powder and soda, corn starch, nut clusters, and other specialty products. It markets its products under various brands, including Ac'cent, B&G, B&M, Baker's Joy, Bear Creek Country Kitchens, Brer Rabbit, Canoleo, Cary's, Clabber Girl, Cream of Rice, Cream of Wheat, Crisco, Dash, Davis, Devonsheer, Don Pepino, Durkee, Grandma's Molasses, Green Giant, Joan of Arc, Las Palmas, Le Sueur, MacDonald's, Mama Mary's, Maple Grove Farms of Vermont, McCann's, Molly McButter, New York Flatbreads, New York Style, Old London, Ortega, Polaner, Red Devil, Regina, Rumford, Sa-són, Sclafani, Spice Islands, Spring Tree, Sugar Twin, Tone's, Trappey's, TrueNorth, Underwood, Vermont Maid, Victoria, Weber, and Wright's. The company also sells, markets, and distributes household products under the Static Guard brand. It sells and distributes its products directly, as well as through a network of independent brokers and distributors to supermarket chains, foodservice outlets, mass merchants, warehouse clubs, non-food outlets, and specialty distributors. The company was formerly known as B&G Foods Holdings Corp. and changed its name to B&G Foods, Inc. in October 2004. B&G Foods, Inc. was founded in 1822 and is headquartered in Parsippany, New Jersey.
- Sector
- Consumer Defensive
- Industry
- Packaged Foods
- Country
- United States
- Website
- bgfoods.com
News
 B&G Foods: 3 Key Takeaways for Long-Term Investors
 Are Investors Undervaluing B&G Foods (BGS) Right Now?
 B&G Foods: A Step In The Right Direction, With Plenty Left To Prove
 B&G Foods Q3 2026 Earnings Call Transcript
 B&G Foods Affirms FY2026 Adj EPS Guidance of $0.57-$0.68 vs $0.55 Est; Raises FY2026 Sales Guidance from $1.735B-$1.775B to $1.760B-$1.800B vs $1.739B Est
 B&G Foods Q3 Adj. EPS $0.21 Beats $0.15 Estimate, Sales $459.800M Beat $435.016M Estimate
- Evercore ISI Group Maintains In-Line on B&G Foods, Lowers Price Target to $3
Your note
Sign in to keep a note on BGS — it syncs with the Stock Master app.
Insider holders
| Insider | Relation | Latest transaction | Date | Shares held |
|---|---|---|---|---|
| GREENBERG JORDAN E. | Officer | Sale | Sep 2, 2024 | 66,095 |
| HART ERIC H | Officer | Purchase | Nov 14, 2024 | 88,899 |
| LERNER SCOTT E | General Counsel | Purchase | Nov 7, 2024 | 196,755 |
| MARCY CHARLES F | Director | Stock Award(Grant) | Jun 2, 2024 | 85,938 |
| MULLEN DENNIS M | Director | Stock Award(Grant) | Jun 2, 2024 | 78,084 |
| PALMER CHERYL M | Director | Stock Award(Grant) | Jun 2, 2024 | 55,554 |
Institution ownership
| Holder | % held | Shares | Value | Reported |
|---|---|---|---|---|
| Blackrock Inc. | 15.52% | 12,285,938 | 87.23M | Sep 29, 2024 |
| Vanguard Group Inc | 12.11% | 9,585,859 | 68.06M | Sep 29, 2024 |
| State Street Corporation | 3.75% | 2,972,528 | 21.10M | Sep 29, 2024 |
| Dimensional Fund Advisors LP | 3.30% | 2,608,659 | 18.52M | Sep 29, 2024 |
| American Century Companies Inc | 2.47% | 1,959,251 | 13.91M | Sep 29, 2024 |
| Morgan Stanley | 2.29% | 1,812,324 | 12.87M | Sep 29, 2024 |
Fund ownership
| Holder | % held | Shares | Value | Reported |
|---|---|---|---|---|
| iShares Core S&P Smallcap ETF | 6.37% | 5,046,645 | 35.83M | Oct 30, 2024 |
| Vanguard Total Stock Market Index Fund | 3.09% | 2,448,201 | 17.38M | Sep 29, 2024 |
| iShares Russell 2000 ETF | 2.49% | 1,968,178 | 13.97M | Oct 30, 2024 |
| Vanguard Small-Cap Index Fund | 2.38% | 1,885,237 | 13.39M | Sep 29, 2024 |
| Avantis U.S. Small Cap Value ETF | 2.06% | 1,631,949 | 11.59M | Sep 29, 2024 |
| Vanguard Small Cap Value Index Fund | 1.61% | 1,274,355 | 9.05M | Sep 29, 2024 |