

Philip Morris International Inc. PM
184.09 USD -2.34 (-1.26%)
Regular-session close
184.25 +0.16 +0.09%
After hours · Nov 20, 7:36 PM ET
183.56 Day range 190.73
147.81 52-week range 211.28
- YTD
- +14.77%
- 1 year
- +18.27%
5D -14.97 (-7.52%)
- Market cap
- 286.93B
- Revenue (ttm)
- 43.14B
- Profit margin
- 24.83%
- EPS (ttm)
- 6.85
- Shares out
- 1.56B
- P/E ratio
- 26.87
- Forward P/E
- 20.36
- Dividend
- 6.40 (3.43%)
- Ex-dividend date
- Oct 2, 2026
- YTD return
- +14.77%
- 1-year return
- +18.27%
- Volume
- 9.60M
- Avg volume
- 4.67M
- Open
- 190.73
- Previous close
- 186.43
- Day's range
- 183.56 – 190.73
- 52-week range
- 147.81 – 211.28
- Beta
- 0.35
- Analysts
- Buy
- Price target
- 212.69 (+15.5%)
- Earnings date
- Feb 5, 2027
- 50-day average
- 196.83
Key statistics
- 200-day average
- 183.50
- Enterprise value
- 333.61B
- PEG ratio
- 2.54
- Price / sales
- 6.65
- Payout ratio
- 87.74%
- Revenue growth
- 5.50%
- Free cash flow
- 11.53B
- Total cash
- 6.69B
- Total debt
- 47.73B
- Short % of float
- 0.96%
Fundamental scorecard
16 of 25 checks passed on PM’s reported financials
16of 25 checks passed
- Value 1 of 5
- Growth 5 of 5
- Profitability 3 of 5
- Financial health 3 of 5
- Dividend 4 of 5
Statements to Sep 30, 2026.
Analyst view
Consensus: buy
Buy
Price target (mean) 212.69 +15.5% upside
Now 184.09
- Target (low)
- 175.00
- Target (mean)
- 212.69
- Target (high)
- 240.00
Ratings (0m) 17 12 buy · 5 hold · 0 sell
- Strong buy3
- Buy9
- Hold5
- Sell0
- Strong sell0
Next earnings
Feb 5, 2027
Expected Feb 5, 2027. Consensus EPS estimate 1.82.
Financials — quick view
PM Revenue — quarterly 11.44B
PM Net income — quarterly 3.31B
PM EPS — quarterly 2.12
Earnings
| Report date | Quarter ending | EPS estimate | EPS reported | Surprise | Surprise % |
|---|---|---|---|---|---|
| Feb 5, 2027 | Dec 30, 2026 | 1.80 | — | — | — |
| Oct 21, 2026 | Sep 30, 2026 | 2.30 | 2.36 | +0.06 | +2.61% |
| Jul 22, 2026 | Jun 30, 2026 | 2.05 | 2.20 | +0.15 | +7.32% |
| Apr 22, 2026 | Mar 31, 2026 | 1.86 | 1.96 | +0.10 | +5.38% |
| Feb 6, 2026 | Dec 31, 2025 | 1.70 | 1.70 | 0.00 | 0.00% |
| Oct 21, 2025 | Sep 30, 2025 | 2.09 | 2.24 | +0.15 | +7.18% |
Upgrades / downgrades
| Date | Firm | Action | From | To |
|---|---|---|---|---|
| Nov 3, 2026 | Stifel | main | Buy | Buy |
| Oct 26, 2026 | Argus Research | main | Buy | Buy |
| Oct 22, 2026 | UBS | main | Neutral | Neutral |
| Oct 22, 2026 | Needham | main | Buy | Buy |
| Sep 23, 2026 | UBS | main | Neutral | Neutral |
| Jul 30, 2026 | Citigroup | main | Buy | Buy |
About Philip Morris International Inc.
Philip Morris International Inc. operates as a tobacco company. The company offers cigarettes and smoke-free products, including heat-not-burn, e-vapor, and oral nicotine products under the IQOS, VEEV, and ZYN brands; and consumer accessories, such as lighters and matches. It also offers wellness products. The company was incorporated in 1987 and is headquartered in Stamford, Connecticut.
- Sector
- Consumer Defensive
- Industry
- Tobacco
- Country
- United States
- Website
- pmi.com
News
 Philip Morris: My Thesis Has Played Out, Smoke-Free Transition Looks Priced In (Rating Downgrade)
 If You Invested $100 In Philip Morris Intl Stock 5 Years Ago, You Would Have This Much Today
 Philip Morris vs. British American Tobacco: Which Tobacco Dividend Is Better for Retirees?
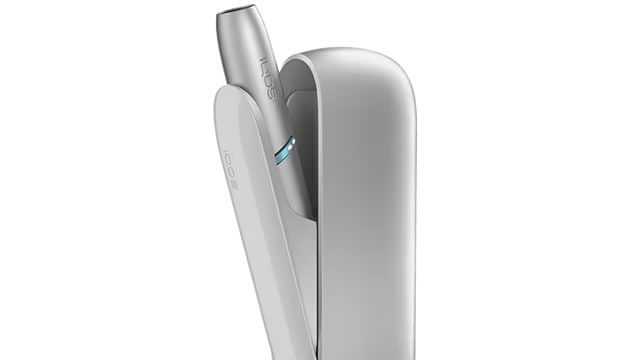 Philip Morris: Still A Buy To Me After The ZYN Price Cut
 Philip Morris International Inc. $PM Stock Bought by Bogart Wealth LLC
 AlTi Global Inc. Sells 35,879 Shares of Philip Morris International Inc. $PM
 JP Morgan Reinstates Neutral on Philip Morris Intl, Announces $200 Price Target
 Nasdaq 100 Jumps 3% as Chips Rebound; Nvidia Lags Most Since DeepSeek: Stock Market Today
 Stifel Maintains Buy on Philip Morris Intl, Raises Price Target to $232
 Here's How Much $1000 Invested In Philip Morris Intl 5 Years Ago Would Be Worth Today
Your note
Sign in to keep a note on PM — it syncs with the Stock Master app.
Institution ownership
| Holder | % held | Shares | Value | Reported |
|---|---|---|---|---|
| Capital World Investors | 8.37% | 130,424,221 | 24.02B | Sep 29, 2026 |
| Blackrock Inc. | 6.97% | 108,635,303 | 20.00B | Sep 29, 2026 |
| Vanguard Capital Management LLC | 6.55% | 102,023,100 | 18.79B | Sep 29, 2026 |
| Capital Research Global Investors | 5.49% | 85,604,051 | 15.76B | Sep 29, 2026 |
| Capital International Investors | 4.31% | 67,125,392 | 12.36B | Sep 29, 2026 |
| State Street Corporation | 3.61% | 56,298,165 | 10.37B | Sep 29, 2026 |
Fund ownership
| Holder | % held | Shares | Value | Reported |
|---|---|---|---|---|
| VANGUARD INDEX FUNDS-Vanguard Total Stock Market Index Fund | 3.17% | 49,479,464 | 9.11B | Jun 29, 2026 |
| WASHINGTON MUTUAL INVESTORS FUND | 2.67% | 41,548,257 | 7.65B | Sep 29, 2026 |
| VANGUARD INDEX FUNDS-Vanguard 500 Index Fund | 2.59% | 40,389,720 | 7.44B | Jun 29, 2026 |
| AMERICAN FUNDS FUNDAMENTAL INVESTORS | 2.27% | 35,455,970 | 6.53B | Sep 29, 2026 |
| AMERICAN BALANCED FUND | 2.23% | 34,683,948 | 6.39B | Sep 29, 2026 |
| Investment Co of America | 1.54% | 23,984,919 | 4.42B | Sep 29, 2026 |