

Advanced Micro Devices, Inc. AMD
Regular-session close
After hours · Nov 20, 7:59 PM ET
- YTD
- +98.16%
- 1 year
- +105.99%
5D -85.96 (-16.84%)
- Market cap
- 702.39B
- Revenue (ttm)
- 45.44B
- Profit margin
- 16.77%
- EPS (ttm)
- 4.68
- Shares out
- 1.66B
- P/E ratio
- 90.68
- Forward P/E
- 23.87
- YTD return
- +98.16%
- 1-year return
- +105.99%
- 50-day average
- 554.93
- Volume
- 70.28M
- Avg volume
- 26.24M
- Open
- 471.94
- Previous close
- 489.19
- Day's range
- 418.76 – 474.79
- 52-week range
- 190.95 – 649.42
- Beta
- 2.54
- Analysts
- Strong Buy
- Price target
- 657.74 (+55.0%)
- Earnings date
- Feb 2, 2027
Key statistics
- 200-day average
- 428.63
- Enterprise value
- 795.75B
- PEG ratio
- 0.47
- Price / sales
- 15.34
- Price / book
- 10.10
- Revenue growth
- 44.70%
- Free cash flow
- 7.36B
- Total cash
- 15.78B
- Total debt
- 9.21B
- Return on equity
- 11.96%
- Short % of float
- 2.36%
Fundamental scorecard
14 of 25 checks passed on AMD’s reported financials
14of 25 checks passed
- Value 0 of 5
- Growth 5 of 5
- Profitability 4 of 5
- Financial health 5 of 5
- Dividend 0 of 5
Statements to Sep 26, 2026.
Analyst view
Consensus: strong buy
- Target (low)
- 525.00
- Target (mean)
- 657.74
- Target (high)
- 1,250.00
- Strong buy5
- Buy42
- Hold7
- Sell0
- Strong sell0
Next earnings
Feb 2, 2027
Expected Feb 2, 2027. Consensus EPS estimate 2.93.
Financials — quick view
Earnings
| Report date | Quarter ending | EPS estimate | EPS reported | Surprise | Surprise % |
|---|---|---|---|---|---|
| Feb 2, 2027 | Dec 26, 2026 | 2.90 | — | — | — |
| Nov 3, 2026 | Sep 26, 2026 | 1.95 | 2.09 | +0.14 | +7.18% |
| Aug 4, 2026 | Jun 27, 2026 | 1.62 | 1.66 | +0.04 | +2.47% |
| May 5, 2026 | Mar 28, 2026 | 1.29 | 1.37 | +0.08 | +6.20% |
| Feb 3, 2026 | Dec 27, 2025 | 1.32 | 1.53 | +0.21 | +15.91% |
| Nov 4, 2025 | Sep 27, 2025 | 1.17 | 1.20 | +0.03 | +2.56% |
Upgrades / downgrades
| Date | Firm | Action | From | To |
|---|---|---|---|---|
| Nov 12, 2026 | B of A Securities | main | Buy | Buy |
| Nov 12, 2026 | RBC Capital | reit | Sector Perform | Sector Perform |
| Nov 12, 2026 | William Blair | up | Market Perform | Outperform |
| Nov 9, 2026 | Oppenheimer | up | Perform | Outperform |
| Nov 4, 2026 | UBS | main | Buy | Buy |
| Nov 4, 2026 | JP Morgan | main | Neutral | Neutral |
About Advanced Micro Devices, Inc.
Advanced Micro Devices, Inc. operates as a semiconductor company internationally. It operates in three segments: Data Center, Client and Gaming, and Embedded. The company offers artificial intelligence (AI) accelerators, microprocessors, and graphics processing units (GPUs) as standalone devices or as incorporated into accelerated processing units, chipsets, and data center and professional GPUs; and embedded processors and semi-custom system-on-chip (SoC) products, microprocessor and SoC development services and technology, data processing units, field programmable gate arrays (FPGA), system on modules, AI network interface cards, and adaptive SoC products. It provides processors under the AMD Ryzen, AMD Ryzen AI, AMD Ryzen PRO, AMD Ryzen Threadripper, AMD Ryzen Threadripper PRO, AMD Athlon, and AMD PRO A-Series brands; graphics under the AMD Radeon graphics and AMD Embedded Radeon graphics; professional graphics under the AMD Radeon Pro graphics brand; and AI and general-purpose compute infrastructure for hyperscale providers. The company offers data center graphics under the AMD Instinct accelerators and Radeon PRO V-series brands; server microprocessors under the AMD EPYC brand; low power solutions under the AMD Athlon, AMD Geode, AMD Ryzen, AMD EPYC, and AMD R-Series and G-Series brands; FPGA products under the Virtex-6, Virtex-7, Virtex UltraScale+, Kintex-7, Kintex UltraScale, Kintex UltraScale+, Artix-7, Artix UltraScale+, Spartan-6, and Spartan-7 brands; adaptive SOCs under the Zynq-7000, Zynq UltraScale+ MPSoC, Zynq UltraScale+ RFSoCs, Versal HBM, Versal Premium, Versal Prime, Versal AI Core, Versal AI Edge, Vitis, and Vivado brands; and compute and network acceleration board products under the Alveo and Pensando brands. It serves original equipment and design manufacturers, public cloud service providers, system integrators, distributors, and add-in-board manufacturers. The company was incorporated in 1969 and is headquartered in Santa Clara, California.
- Sector
- Technology
- Industry
- Semiconductors
- Country
- United States
- Website
- amd.com
News
 Prediction: These Will Be AMD's and Nvidia's Stock Prices by 2028
 Dow Jones and S&P 500 Outlook: Top Stock Market Headlines and Data This Week
 AMD: Why I'm Buying This Correction
 AMD Stock Just Plunged on a Short-Seller Report. Is This a Golden Buying Opportunity?
 Billionaire David Tepper Just Made a Massive AI Chip Rotation — Will It Pay Off?
 AMD's Data Center Sales Jumped 97%. Is the Stock a Buy?
 Nvidia in more trouble? These 2 stocks set to outperform NVDA in 2027
 Consumer Tech (Nov 16-20): Anthropic Makes A Smashing Debut, GTA 6 Releases & More
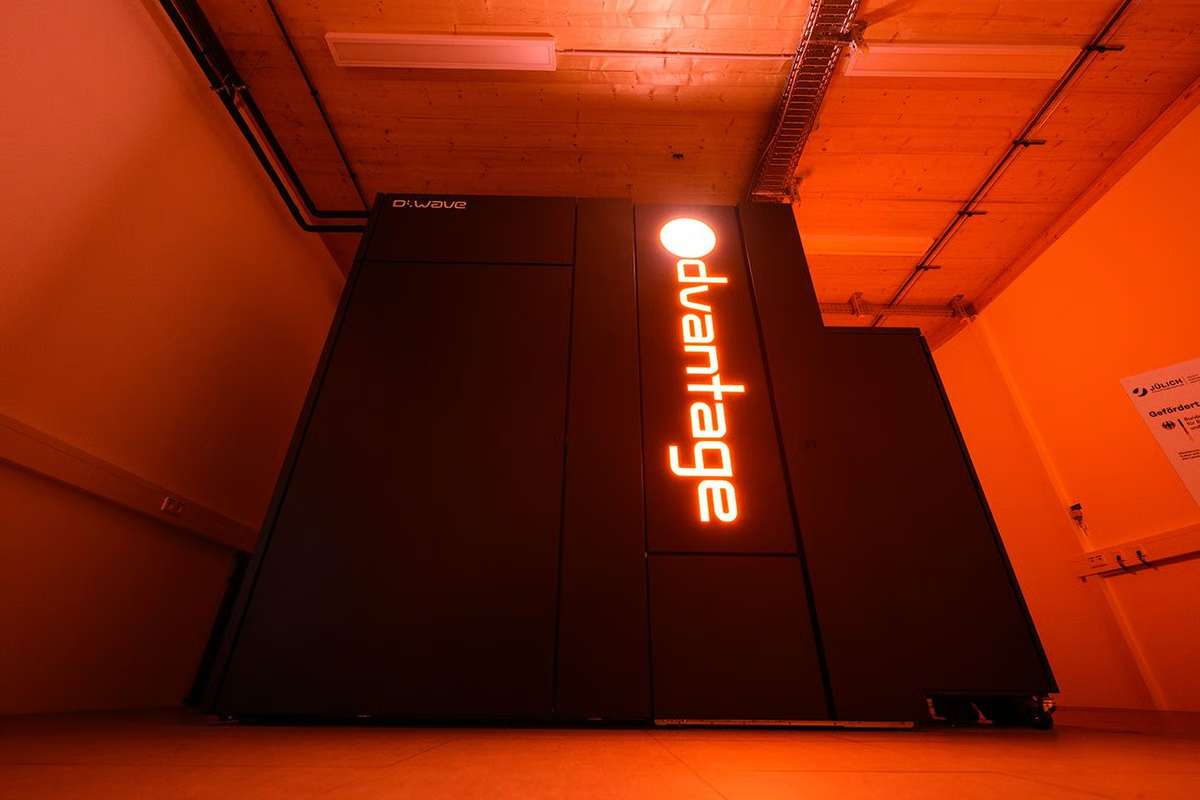 Got $500? 2 Quantum Computing Stocks to Buy Right Now
 Nvidia Just Issued a Major Warning to AMD and Intel Stock Investors
Your note
Sign in to keep a note on AMD — it syncs with the Stock Master app.
Insider holders
| Insider | Relation | Latest transaction | Date | Shares held |
|---|---|---|---|---|
| DENZEL NORA M | Director | Sale | Jun 1, 2026 | 87,173 |
| GRASBY PAUL DARREN | Officer | Conversion of Exercise of derivative security | Nov 12, 2026 | 117,970 |
| GUIDO PHILIP | Officer | Conversion of Exercise of derivative security | Nov 12, 2026 | 135,295 |
| HAHN AVA M | General Counsel | Sale | Nov 16, 2026 | 26,723 |
| HU JEAN X | Chief Financial Officer | Conversion of Exercise of derivative security | Nov 12, 2026 | 180,615 |
| HUYNH JACK M | Officer | Conversion of Exercise of derivative security | Nov 12, 2026 | 497,784 |
Institution ownership
| Holder | % held | Shares | Value | Reported |
|---|---|---|---|---|
| Blackrock Inc. | 9.30% | 152,491,791 | 64.20B | Sep 29, 2026 |
| Vanguard Capital Management LLC | 6.52% | 106,857,517 | 44.99B | Sep 29, 2026 |
| State Street Corporation | 4.60% | 75,437,436 | 31.76B | Sep 29, 2026 |
| Invesco Ltd. | 3.29% | 54,011,763 | 22.74B | Sep 29, 2026 |
| FMR, LLC | 3.25% | 53,290,183 | 22.43B | Sep 29, 2026 |
| Geode Capital Management, LLC | 2.46% | 40,409,652 | 17.01B | Sep 29, 2026 |
Fund ownership
| Holder | % held | Shares | Value | Reported |
|---|---|---|---|---|
| VANGUARD INDEX FUNDS-Vanguard Total Stock Market Index Fund | 3.16% | 51,765,887 | 21.79B | Jun 29, 2026 |
| VANGUARD INDEX FUNDS-Vanguard 500 Index Fund | 2.58% | 42,255,843 | 17.79B | Jun 29, 2026 |
| Invesco QQQ Trust, Series 1 | 2.08% | 34,098,329 | 14.36B | Sep 29, 2026 |
| iShares Trust-iShares Core S&P 500 ETF | 1.33% | 21,752,094 | 9.16B | Sep 29, 2026 |
| Fidelity Concord Street Trust-Fidelity 500 Index Fund | 1.29% | 21,215,590 | 8.93B | Sep 29, 2026 |
| SPDR S&P 500 ETF TRUST-State Street SPDR S&P 500 ETF Trust | 1.23% | 20,195,045 | 8.50B | Sep 29, 2026 |