

Yum! Brands, Inc. YUM
Regular-session close
After hours · Nov 13, 5:05 PM ET
- YTD
- +6.64%
- 1 year
- +7.75%
- Market cap
- 43.28B
- Revenue (ttm)
- 8.80B
- Profit margin
- 39.14%
- EPS (ttm)
- 12.42
- Shares out
- 268.26M
- P/E ratio
- 12.99
- Forward P/E
- 24.05
- Dividend
- 3.00 (1.88%)
- Ex-dividend date
- Sep 9, 2026
- YTD return
- +6.64%
- 1-year return
- +7.75%
- Volume
- 1.78M
- Avg volume
- 2.40M
- Open
- 160.76
- Previous close
- 159.34
- Day's range
- 160.05 – 163.10
- 52-week range
- 135.75 – 168.16
- Beta
- 0.53
- Analysts
- Buy
- Price target
- 175.32 (+8.7%)
- Earnings date
- Feb 3, 2027
5D +0.82 (+0.51%)
Key statistics
- Enterprise value
- 53.39B
- PEG ratio
- 2.13
- Price / sales
- 4.92
- Price / book
- 0.00
- Dividend yield
- 1.88%
- Payout ratio
- 23.83%
- Revenue growth
- 3.80%
- Free cash flow
- 1.33B
- Total cash
- 2.11B
- Total debt
- 12.75B
- Return on equity
- 0.00%
- Short % of float
- 5.36%
- 50-day average
- 147.48
- 200-day average
- 153.71
Analyst view
Consensus: buy
- Target (low)
- 153.00
- Target (mean)
- 175.32
- Target (high)
- 200.00
- Strong buy2
- Buy10
- Hold13
- Sell0
- Strong sell1
Next earnings
Feb 3, 2027
Expected Feb 3, 2027. Consensus EPS estimate 1.72.
Financials — quick view
Earnings
| Report date | Quarter ending | EPS estimate | EPS reported | Surprise | Surprise % |
|---|---|---|---|---|---|
| Feb 3, 2027 | Dec 30, 2026 | 1.75 | — | — | — |
| Nov 3, 2026 | Sep 30, 2026 | 1.50 | 1.56 | +0.06 | +4.00% |
| Jul 30, 2026 | Jun 30, 2026 | 1.57 | 1.62 | +0.05 | +3.18% |
| Apr 29, 2026 | Mar 31, 2026 | 1.38 | 1.50 | +0.12 | +8.70% |
| Feb 4, 2026 | Dec 31, 2025 | 1.76 | 1.73 | -0.03 | -1.70% |
| Nov 4, 2025 | Sep 30, 2025 | 1.49 | 1.58 | +0.09 | +6.04% |
Upgrades / downgrades
| Date | Firm | Action | From | To |
|---|---|---|---|---|
| Nov 5, 2026 | Guggenheim | main | Buy | Buy |
| Nov 4, 2026 | Citigroup | main | Neutral | Neutral |
| Nov 4, 2026 | RBC Capital | main | Sector Perform | Sector Perform |
| Nov 4, 2026 | BTIG | reit | Neutral | Neutral |
| Nov 3, 2026 | TD Cowen | main | Buy | Buy |
| Oct 21, 2026 | Citigroup | main | Neutral | Neutral |
About Yum! Brands, Inc.
Yum! Brands, Inc., together with its subsidiaries, develops, operates, and franchises traditional and non-traditional quick service restaurants in the United States, China, and internationally. The company operates in four segments: KFC Division, Taco Bell Division, Pizza Hut Division, and Habit Burger & Grill Division. It also operates restaurants under the KFC, Pizza Hut, Taco Bell, and Habit Burger & Grill brands, which specialize in chicken, Mexican-style food and pizza categories, made-to-order chargrilled burgers, sandwiches, and other products. The company was formerly known as TRICON Global Restaurants, Inc. and changed its name to Yum! Brands, Inc. in May 2002. Yum! Brands, Inc. was incorporated in 1997 and is headquartered in Louisville, Kentucky.
- Sector
- Consumer Cyclical
- Industry
- Restaurants
- Country
- United States
- Website
- yum.com
News
 Yum China Doubles Restaurant Count To 20K+ In Just 6 Years
 Yum! Brands, Inc. Declares Quarterly Dividend of $0.75 Per Share
 KFC's "Finger Lickin' Fan Fest"* Gives Rewards Members 2X Points and More Ways to Score Free Food
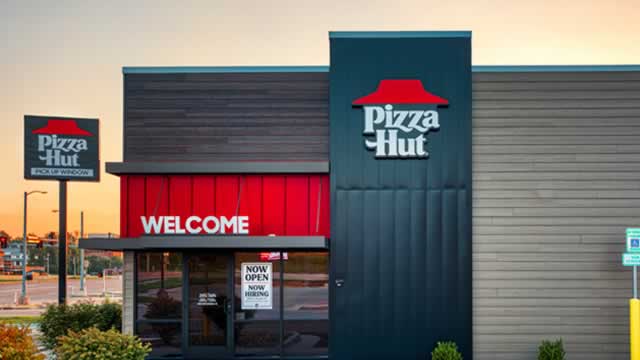 Uni-President in advanced talks to buy Jardine's KFC, Pizza Hut business in Asia, sources say
 Guggenheim Maintains Buy on Yum Brands, Raises Price Target to $180
 Citigroup Maintains Neutral on Yum Brands, Raises Price Target to $171
- RBC Capital Maintains Sector Perform on Yum Brands, Raises Price Target to $180
 This Yum! Brands Analyst Raises Price Target After Q3 Results
 If You Invested $100 In Yum Brands Stock 20 Years Ago, You Would Have This Much Today
- TD Cowen Maintains Buy on Yum Brands, Raises Price Target to $180
Your note
Sign in to keep a note on YUM — it syncs with the Stock Master app.
Insider holders
| Insider | Relation | Latest transaction | Date | Shares held |
|---|---|---|---|---|
| DOMIER TANYA L | Director | Conversion of Exercise of derivative security | Mar 31, 2026 | 0 |
| GIBBS DAVID W | Chief Executive Officer | Sale | Sep 14, 2025 | 223,786 |
| NELSON THOMAS C | Director | Conversion of Exercise of derivative security | Nov 6, 2025 | 23,291 |
| POWELL AARON | Officer | Sale | Jun 30, 2026 | 12,003 |
| RUSSELL DAVID ERIC | Officer | Sale | Aug 2, 2026 | 11,960 |
| SAMI SABIR | Officer | Conversion of Exercise of derivative security | Feb 10, 2025 | 5,507 |
Institution ownership
| Holder | % held | Shares | Value | Reported |
|---|---|---|---|---|
| Blackrock Inc. | 9.76% | 26,190,487 | 4.22B | Jun 29, 2026 |
| Capital International Investors | 6.86% | 18,411,516 | 2.97B | Sep 29, 2026 |
| Vanguard Capital Management LLC | 6.71% | 18,000,462 | 2.90B | Jun 29, 2026 |
| JPMORGAN CHASE & CO | 6.36% | 17,071,747 | 2.75B | Sep 29, 2026 |
| Vanguard Portfolio Management LLC | 5.22% | 13,996,754 | 2.26B | Jun 29, 2026 |
| State Street Corporation | 4.88% | 13,083,129 | 2.11B | Sep 29, 2026 |
Fund ownership
| Holder | % held | Shares | Value | Reported |
|---|---|---|---|---|
| WASHINGTON MUTUAL INVESTORS FUND | 3.67% | 9,835,751 | 1.59B | Sep 29, 2026 |
| VANGUARD INDEX FUNDS-Vanguard Total Stock Market Index Fund | 3.26% | 8,749,332 | 1.41B | Jun 29, 2026 |
| VANGUARD INDEX FUNDS-Vanguard 500 Index Fund | 2.66% | 7,141,043 | 1.15B | Jun 29, 2026 |
| VANGUARD INDEX FUNDS-Vanguard Mid-Cap Index Fund | 2.23% | 5,972,471 | 963.45M | Jun 29, 2026 |
| VANGUARD WELLINGTON FUND | 1.80% | 4,820,760 | 777.66M | Aug 30, 2026 |
| J.P. Morgan Exch-Trd Fd. TRT-JPMorgan Eqy. Premium Income ETF | 1.44% | 3,875,321 | 625.15M | Jun 29, 2026 |