

Worthington Steel, Inc. WS
At closeNov 5, 2026, 4:00 PM EST
After hours · Nov 5, 4:00 PM ET
- YTD
- +3.70%
- 1 year
- +13.32%
- Market cap
- 1.84B
- Revenue (ttm)
- 5.30B
- Profit margin
- -0.72%
- EPS (ttm)
- -0.71
- Shares out
- 51.22M
- Forward P/E
- 8.70
- Dividend
- 0.64 (1.59%)
- Ex-dividend date
- Dec 13, 2026
- YTD return
- +3.70%
- 1-year return
- +13.32%
- Volume
- 495.75K
- Avg volume
- 363.58K
- Open
- 40.53
- Previous close
- 40.48
- Day's range
- 35.87 – 40.99
- 52-week range
- 27.22 – 49.17
- Beta
- 2.10
- Price target
- 46.00 (+28.1%)
- Earnings date
- Dec 16, 2026
5D -5.57 (-13.43%)
Key statistics
- Enterprise value
- 5.07B
- PEG ratio
- 0.00
- Price / sales
- 0.39
- Price / book
- 1.96
- Dividend yield
- 1.59%
- Payout ratio
- 376.47%
- Revenue growth
- 212.40%
- Free cash flow
- -1.47B
- Total cash
- 248.20M
- Total debt
- 2.59B
- Return on equity
- -3.40%
- Short % of float
- 7.14%
- 50-day average
- 36.95
- 200-day average
- 37.67
Analyst view
- Strong buy0
- Buy1
- Hold1
- Sell0
- Strong sell0
Next earnings
Dec 16, 2026
Expected Dec 16, 2026. Consensus EPS estimate 0.84.
Financials — quick view
Earnings
| Report date | Quarter ending | EPS estimate | EPS reported | Surprise | Surprise % |
|---|---|---|---|---|---|
| Dec 16, 2026 | Nov 30, 2026 | 0.84 | — | — | — |
| Oct 6, 2026 | Aug 31, 2026 | 0.92 | 0.57 | -0.35 | -38.04% |
| Jun 24, 2026 | May 31, 2026 | 0.73 | 0.74 | +0.01 | +1.37% |
| Mar 25, 2026 | Feb 28, 2026 | 0.4619 | 0.27 | -0.19 | -41.55% |
| Dec 17, 2025 | Nov 30, 2025 | 0.39 | 0.38 | -0.01 | -2.56% |
| Sep 24, 2025 | Aug 31, 2025 | 0.74 | 0.77 | +0.03 | +4.05% |
Upgrades / downgrades
| Date | Firm | Action | From | To |
|---|---|---|---|---|
| Jun 2, 2026 | Keybanc | main | Overweight | Overweight |
| Mar 27, 2026 | Keybanc | main | Overweight | Overweight |
| Mar 25, 2026 | Keybanc | main | Overweight | Overweight |
| Jan 23, 2026 | Keybanc | main | Overweight | Overweight |
| Dec 16, 2025 | Keybanc | main | Overweight | Overweight |
| Sep 16, 2025 | Keybanc | main | Overweight | Overweight |
About Worthington Steel, Inc.
Worthington Steel, Inc., together with its subsidiaries, operates as a steel processor in the United States, Canada, Mexico, and internationally. The company offers carbon flat-rolled steel processing services, including pickling, specialty re-rolling, hot dip galvanizing, blanking, slitting, and cutting-to-length; laser welded solutions; precision magnetic steel laminations for the automotive, industrial motor, generator, and transformer industries; tailor and aluminum tailor welded blanks; steel toll processing services for steel mills, large end-users, and service centers; and automotive and electrical steel lamination stampings. It serves the automotive, construction, machinery and equipment, agriculture, heavy truck, and energy sectors. Worthington Steel, Inc. was incorporated in 2023 and is headquartered in Columbus, Ohio.
- Sector
- Basic Materials
- Industry
- Steel
- Country
- United States
- Website
- worthingtonsteel.com
News
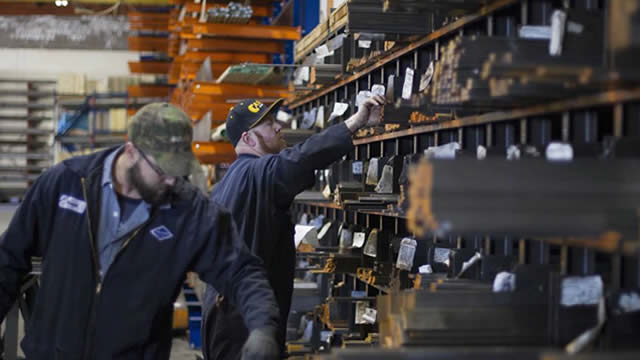 All You Need to Know About Worthington Steel, Inc. (WS) Rating Upgrade to Buy
 Worthington Steel Announces Its Proposed Domination And Profit And Loss Transfer Agreement With Kloeckner & Co Failed To Receive Shareholders' Approval At Kloeckner & Co; Domination And Profit And Loss Transfer Agreement To Not Become Effective
 Worthington Steel Confirms Its Kloeckner Strategy Following Shareholder Vote
 Worthington Steel Issues Statement Ahead of Kloeckner & Co Extraordinary General Meeting
 Worthington Steel Issues Statement Ahead of Kloeckner & Co Extraordinary General Meeting
 A Look at Worthington Steel Inc (WS) After 4.1% Gain -- GF Value $50.71 vs Price $36.05
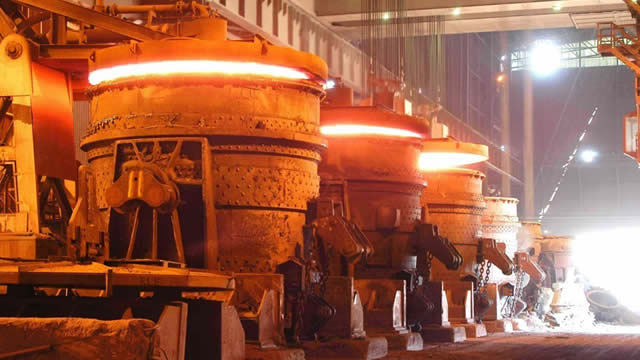 Worthington Steel: 212% Revenue Growth, Yet EPS Went Backward
 Worthington Steel, Inc. (WS) Q1 2027 Earnings Call Transcript
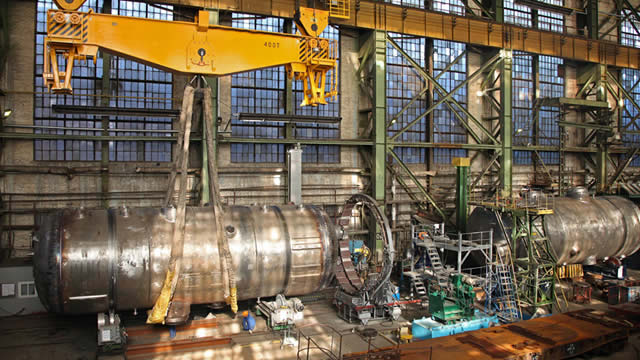 Why Worthington Steel Melted Down on Wednesday
 Worthington Steel Q1 Earnings Call Highlights
Your note
Sign in to keep a note on WS — it syncs with the Stock Master app.
Insider holders
| Insider | Relation | Latest transaction | Date | Shares held |
|---|---|---|---|---|
| ADAMS TIMOTHY A | Chief Financial Officer | Stock Award(Grant) | Oct 7, 2026 | 59,970 |
| BLYSTONE JOHN B | Officer and Director | Stock Award(Grant) | Oct 7, 2026 | 249,043 |
| DAVIS MARK C | Director | Stock Award(Grant) | Oct 7, 2026 | 26,844 |
| GILMORE GEOFFREY G | Chief Executive Officer | Stock Award(Grant) | Oct 7, 2026 | 366,050 |
| KLINGLER JEFFREY R | Chief Operating Officer | Stock Award(Grant) | Oct 7, 2026 | 117,076 |
| MCCONNELL JOHN H II | Director | Stock Award(Grant) | Oct 7, 2026 | 49,037 |
Institution ownership
| Holder | % held | Shares | Value | Reported |
|---|---|---|---|---|
| Blackrock Inc. | 9.97% | 5,107,237 | 206.69M | Jun 29, 2026 |
| Dimensional Fund Advisors LP | 5.01% | 2,566,114 | 103.85M | Jun 29, 2026 |
| Vanguard Portfolio Management LLC | 4.45% | 2,280,211 | 92.28M | Jun 29, 2026 |
| State Street Corporation | 4.06% | 2,078,892 | 84.13M | Jun 29, 2026 |
| Vanguard Capital Management LLC | 3.22% | 1,650,805 | 66.81M | Jun 29, 2026 |
| T. Rowe Price Investment Management, Inc. | 2.38% | 1,218,254 | 49.30M | Jun 29, 2026 |
Fund ownership
| Holder | % held | Shares | Value | Reported |
|---|---|---|---|---|
| iShares Trust-iShares Core S&P Small-Cap ETF | 3.79% | 1,940,237 | 78.52M | Sep 29, 2026 |
| VANGUARD INDEX FUNDS-Vanguard Total Stock Market Index Fund | 2.37% | 1,212,520 | 49.07M | Jun 29, 2026 |
| VANGUARD INDEX FUNDS-Vanguard Small-Cap Index Fund | 1.70% | 872,601 | 35.31M | Jun 29, 2026 |
| iShares Trust-iShares Russell 2000 ETF | 1.69% | 867,955 | 35.13M | Sep 29, 2026 |
| SPDR SERIES TRUST-State Street SPDR S&P Metals & Mining ETF | 1.54% | 789,222 | 31.94M | Sep 29, 2026 |
| VANGUARD INDEX FUNDS-Vanguard Small-Cap Value Index Fund | 1.08% | 553,577 | 22.40M | Jun 29, 2026 |