

Oasis Petroleum Inc WLL
At closeJun 30, 2022, 4:01 PM EDT
52-week range unavailable
- Market cap
- 2.67B
- Revenue (ttm)
- 1.75B
- Profit margin
- 22.33%
- Shares out
- 39.24M
- Forward P/E
- 2.51
- Dividend
- 1.00 (1.47%)
- Ex-dividend date
- May 18, 2022
- Volume
- 2.86M
- Open
- 70.86
- Previous close
- 68.03
- Day's range
- 67.51 – 72.40
- Analysts
- Hold
- Price target
- 105.20 (+54.6%)
- Earnings date
- Aug 3, 2022
1Y +3.09 (+4.76%)
Key statistics
- Enterprise value
- 2.74B
- PEG ratio
- 0.72
- Price / sales
- 1.52
- Price / book
- 1.65
- Dividend yield
- 1.47%
- Payout ratio
- 2.54%
- Revenue growth
- 71.40%
- Free cash flow
- -20.70M
- Total cash
- 208.00K
- Total debt
- 69.52M
- Return on equity
- 27.52%
- Short % of float
- 8.94%
- 50-day average
- 79.81
- 200-day average
- 73.09
Analyst view
Consensus: hold
- Target (low)
- 86.00
- Target (mean)
- 105.20
- Target (high)
- 123.00
- Strong buy7
- Buy5
- Hold15
- Sell4
- Strong sell2
Next earnings
Aug 3, 2022
Expected Aug 3, 2022. Consensus EPS estimate 5.80.
Financials — quick view
Earnings
| Report date | Quarter ending | EPS estimate | EPS reported | Surprise | Surprise % |
|---|---|---|---|---|---|
| Aug 3, 2022 | Jun 1, 2022 | 5.12 | — | — | — |
| May 4, 2022 | Mar 1, 2022 | 5.04 | — | — | — |
| Feb 23, 2022 | Dec 1, 2021 | 3.68 | — | — | — |
| Nov 3, 2021 | Sep 1, 2021 | 2.93 | — | — | — |
| Aug 4, 2021 | Jun 1, 2021 | 2.45 | — | — | — |
| May 5, 2021 | Mar 1, 2021 | 1.45 | — | — | — |
Upgrades / downgrades
| Date | Firm | Action | From | To |
|---|---|---|---|---|
| Apr 8, 2022 | Keybanc | main | — | Overweight |
| Apr 7, 2022 | Piper Sandler | main | — | Neutral |
| Mar 14, 2022 | Wells Fargo | main | — | Equal-Weight |
| Mar 10, 2022 | Piper Sandler | main | — | Neutral |
| Mar 8, 2022 | Keybanc | main | — | Overweight |
| Jan 20, 2022 | Keybanc | main | — | Overweight |
About Oasis Petroleum Inc
Whiting Petroleum Corporation, an independent oil and gas company, engages in the acquisition, development, and production of crude oil, natural gas, and natural gas liquids primarily in the Rocky Mountains region of the United States. The company sells its oil and gas production to end users, marketers, and other purchasers. As of December 31, 2021, it had interests in 1,917 net productive wells on approximately 539,900 net developed acres, as well as total estimated proved reserves of 326.0 million barrels of oil equivalent. The company was founded in 1980 and is headquartered in Denver, Colorado.
- Sector
- Energy
- Industry
- Oil & Gas E&P
- Country
- United States
- Website
- whiting.com
News
 Here's Why Hold Strategy is Apt for MPLX Stock Right Now
 Strength Seen in Whiting Petroleum Corporation (WLL): Can Its 5.5% Jump Turn into More Strength?
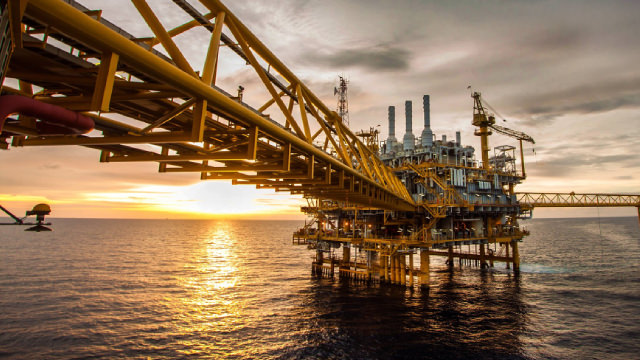 Permian Basin & Eagle Ford Crude Oil Rig Count Increases
 Best Value Stocks to Buy for June 21st
 Permian Crude Oil Rig Count Flat, Eagle Ford Tally Increases
 Can Whiting Petroleum Corporation (WLL) Run Higher on Rising Earnings Estimates?
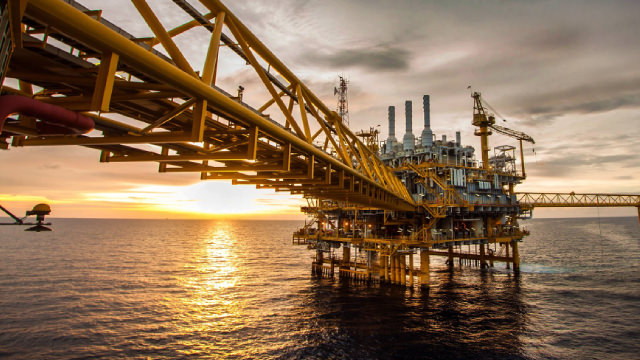 Permian Oil Rig Count Declines Despite High Crude Price
 Whiting (WLL) Stock Rises Since Q1 Earnings: Here's Why
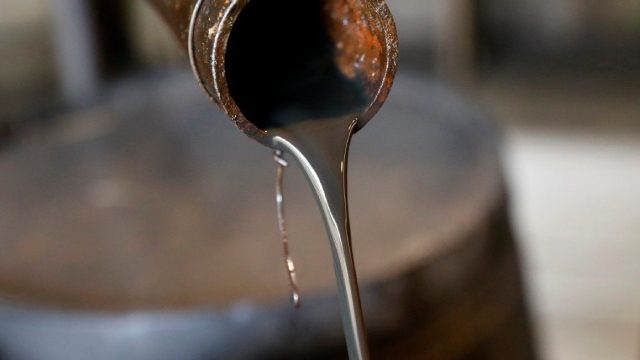 Permian Oil Rig Count Rises After Being Flat in Past 2 Weeks
 A Look Into Energy Sector Value Stocks
Your note
Sign in to keep a note on WLL — it syncs with the Stock Master app.
Insider holders
| Insider | Relation | Latest transaction | Date | Shares held |
|---|---|---|---|---|
| CARRIG JANET L. | Director | Stock Award(Grant) | May 31, 2021 | 10,069 |
| HENDERSON JAMES P | Chief Financial Officer | Stock Award(Grant) | Feb 3, 2022 | 34,854 |
| KORUS PAUL J | Director | Stock Award(Grant) | Mar 14, 2022 | 14,581 |
| LOHOEFENER SIRIKKA R. | Officer | Conversion of Exercise of derivative security | Feb 1, 2022 | 1,692 |
| MCCARTHY KEVIN S | Director | Stock Award(Grant) | May 31, 2022 | 24,797 |
| PETERSON LYNN ALAN | Chief Executive Officer | Stock Award(Grant) | Feb 3, 2022 | 70,447 |
Institution ownership
| Holder | % held | Shares | Value | Reported |
|---|---|---|---|---|
| FMR, LLC | 12.74% | 5,000,395 | 340.18M | Mar 30, 2022 |
| Vanguard Group, Inc. (The) | 9.57% | 3,755,411 | 255.48M | Mar 30, 2022 |
| Wellington Management Group, LLP | 9.32% | 3,655,760 | 248.70M | Mar 30, 2022 |
| Blackrock Inc. | 6.96% | 2,730,465 | 185.75M | Mar 30, 2022 |
| State Street Corporation | 4.35% | 1,708,607 | 116.24M | Mar 30, 2022 |
| Boston Partners | 3.58% | 1,403,637 | 95.49M | Mar 30, 2022 |
Fund ownership
| Holder | % held | Shares | Value | Reported |
|---|---|---|---|---|
| Fidelity Low-Priced Stock Fund | 10.02% | 3,930,076 | 267.36M | Apr 29, 2022 |
| Vanguard Explorer Fund, Inc. | 3.28% | 1,288,725 | 87.67M | Apr 29, 2022 |
| Vanguard Total Stock Market Index Fund | 2.87% | 1,126,468 | 76.63M | Mar 30, 2022 |
| Allspring Special Small Cap Value Fund | 2.53% | 992,748 | 67.54M | Apr 29, 2022 |
| Vanguard Small-Cap Index Fund | 2.51% | 984,052 | 66.95M | Mar 30, 2022 |
| iShares Russell 2000 ETF | 2.23% | 875,886 | 59.59M | May 30, 2022 |