

Vedanta Limited VEDL
Day range unavailable
52-week range unavailable
- Market cap
- 15.37B
- Revenue (ttm)
- 1.09T
- Profit margin
- 17.06%
- Shares out
- 929.30M
- Dividend
- 1.51 (9.05%)
- Ex-dividend date
- Sep 9, 2021
- Beta
- 1.59
2Y -0.18 (-1.08%)
Key statistics
- Enterprise value
- 387.49B
- PEG ratio
- 0.00
- Price / sales
- 0.01
- Price / book
- 0.02
- Dividend yield
- 9.05%
- Payout ratio
- 54.57%
- Revenue growth
- 44.40%
- Free cash flow
- 154.50B
- Total cash
- 316.61B
- Total debt
- 515.70B
- Return on equity
- 30.51%
- Short % of float
- 0.00%
- 50-day average
- 16.55
- 200-day average
- 15.57
Next earnings
Consensus EPS estimate 0.00.
Financials — quick view
Upgrades / downgrades
| Date | Firm | Action | From | To |
|---|---|---|---|---|
| Feb 1, 2019 | CLSA | down | Buy | Sell |
| Oct 5, 2016 | Citigroup | up | Neutral | Buy |
| Jun 9, 2016 | CLSA | up | Sell | Buy |
About Vedanta Limited
Vedanta Limited operates as a diversified natural resources company in India. It explores for, develops, extracts, produces, processes, and sells oil and gas, zinc, lead, silver, copper, aluminum, iron ore, steel, pig iron, and metallurgical coke. The company also operates a thermal coal-based commercial power facility of 600 megawatts (MW) at Jharsuguda in the State of Odisha in eastern India; 2 units of 300 MW thermal coal based power plants at Korba; 1,980 MW thermal coal- based commercial power facilities; 274MW of wind power plants; and a power plant situated at Mettur Dam in the state of Tamil Nadu in southern India. In addition, it manufactures and supplies billets, TMT bars, wire rods, and ductile iron pipes; engages in the mechanization of coal handling facilities and upgradation of general cargo berth for handling coal at the outer harbor of Visakhapatnam Port on the east coast of India; and provides logistics and other allied services inter alia rendering stevedoring, and other allied services in ports and other allied sectors. Further, the company is involved in manufacturing glass substrates in South Korea and Taiwan. It also operates in South Africa, Namibia, Ireland, Australia, Liberia, and the United Arab Emirates. The company was formerly known as Sesa Sterlite Limited and changed its name to Vedanta Limited in March 2015. The company was founded in 1954 and is based in Mumbai, India. Vedanta Limited is a subsidiary of Vedanta Resources Limited.
- Sector
- Basic Materials
- Industry
- Other Industrial Metals & Mining
- Country
- India
- Website
- vedantalimited.com
News
 Vedanta Limited Delivers Highest-ever Half-yearly Profit of $1.21 bn, up 151% YoY
 Vedanta Ltd Doubles Zinc Capacity in South Africa with US$ 600 Mn investment
 Vedanta Completes Historic Demerger, Lists Four New Companies on BSE and NSE
 Vedanta FY26 Profit Soars by 22% to $2.8 bn; Enters Demerger Phase
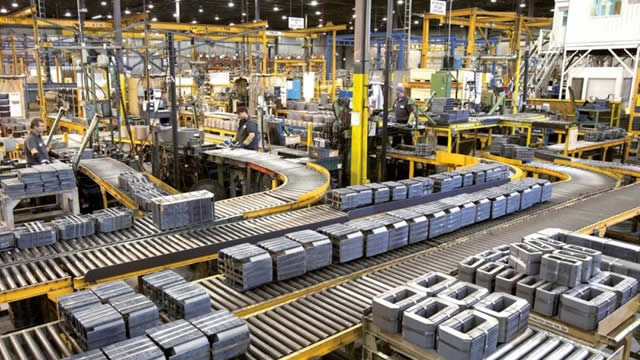 LME aluminium to hit $4,000/ton? Indian stocks Vedanta, Hindalco upgraded
 Vedanta Ltd Reports Record-Breaking Q3: Profit Surges 60% to $0.9 Bn, Revenue up 19%
 Vedanta Resources Reports Second-Highest Ever Revenue and EBITDA in H1FY26
 PureTech Founded Entity Vedanta Biosciences Announces Phase 2 Study of VE202 in Ulcerative Colitis Did Not Meet Primary Endpoint
 Vedanta's Q1 Adjusted Profit Surges 10% to $584 Million
 Vedanta shares slide upto 8% after US-based short seller labels Group a ‘Ponzi Scheme'
Your note
Sign in to keep a note on VEDL — it syncs with the Stock Master app.
Institution ownership
| Holder | % held | Shares | Value | Reported |
|---|---|---|---|---|
| Mirae Asset Global Investments Co., Ltd. | 0.50% | 4,671,903 | 71.39M | Sep 29, 2021 |
| Blackrock Inc. | 0.50% | 4,664,941 | 71.28M | Sep 29, 2021 |
| Baillie Gifford and Company | 0.45% | 4,182,806 | 63.91M | Sep 29, 2021 |
| Contrarian Capital Management, LLC | 0.33% | 3,056,874 | 43.41M | Jun 29, 2021 |
| State Street Corporation | 0.30% | 2,824,336 | 40.11M | Jun 29, 2021 |
| Parametric Portfolio Associates | 0.18% | 1,630,362 | 23.15M | Jun 29, 2021 |
Fund ownership
| Holder | % held | Shares | Value | Reported |
|---|---|---|---|---|
| Global X Fds-Global X Copper Miners ETF | 0.41% | 3,838,907 | 58.66M | Sep 29, 2021 |
| DFA Investment Dimensions-DFA Emerging Mkts Value | 0.05% | 441,108 | 7.07M | Jul 30, 2021 |
| VanEck Vectors ETF Tr-Steel ETF | 0.05% | 432,357 | 6.61M | Sep 29, 2021 |
| SPDR (R) Idx Shares-SPDR Global Natural Resources ETF | 0.03% | 307,315 | 4.70M | Sep 29, 2021 |
| First Tr Exchange Traded Fd-First Tr Chindia ETF | 0.02% | 197,847 | 3.02M | Sep 29, 2021 |
| PIMCO RAFI Dynamic Multi-Factor Emerging Markets Equity ETF | 0.02% | 139,997 | 1.99M | Jun 29, 2021 |