

Vale S.A. VALE
Nov 5, 2026, 2:45 PM EST
- YTD
- -11.78%
- 1 year
- -6.62%
- Market cap
- 48.88B
- Revenue (ttm)
- 215.83B
- Profit margin
- 1.01%
- EPS (ttm)
- 0.16
- Shares out
- 4.26B
- P/E ratio
- 71.79
- Forward P/E
- 6.10
- Dividend
- 0.84 (3.91%)
- Ex-dividend date
- Aug 12, 2026
- YTD return
- -11.78%
- 1-year return
- -6.62%
- Volume
- 30.70M
- Avg volume
- 32.45M
- Open
- 11.51
- Previous close
- 11.43
- Day's range
- 11.32 – 11.60
- 52-week range
- 10.96 – 17.94
- Beta
- 0.73
- Analysts
- Buy
- Price target
- 15.33 (+33.4%)
- Earnings date
- Feb 11, 2027
2Y +0.65 (+6.01%)
Key statistics
- Enterprise value
- 135.54B
- PEG ratio
- 0.26
- Price / sales
- 0.23
- Price / book
- 1.25
- Dividend yield
- 7.68%
- Payout ratio
- 526.96%
- Revenue growth
- -3.90%
- Free cash flow
- 8.64B
- Total cash
- 26.09B
- Total debt
- 109.95B
- Return on equity
- 0.26%
- Short % of float
- 1.34%
- 50-day average
- 13.73
- 200-day average
- 15.22
Analyst view
Consensus: buy
- Target (low)
- 9.50
- Target (mean)
- 15.33
- Target (high)
- 22.00
- Strong buy5
- Buy7
- Hold12
- Sell1
- Strong sell0
Next earnings
Feb 11, 2027
Expected Feb 11, 2027. Consensus EPS estimate 0.50.
Financials — quick view
Earnings
| Report date | Quarter ending | EPS estimate | EPS reported | Surprise | Surprise % |
|---|---|---|---|---|---|
| Feb 11, 2027 | Dec 30, 2026 | 0.3946 | — | — | — |
| Oct 29, 2026 | Sep 30, 2026 | 0.3842 | 0.29 | -0.09 | -24.52% |
| Jul 30, 2026 | Jun 30, 2026 | 0.41 | 0.36 | -0.05 | -12.20% |
| Apr 28, 2026 | Mar 31, 2026 | 0.47 | 0.44 | -0.03 | -6.38% |
| Feb 12, 2026 | Dec 31, 2025 | 0.57 | -0.90 | -1.47 | -257.89% |
| Oct 30, 2025 | Sep 30, 2025 | 0.49 | 0.63 | +0.14 | +28.57% |
Upgrades / downgrades
| Date | Firm | Action | From | To |
|---|---|---|---|---|
| Nov 3, 2026 | Wells Fargo | main | Equal-Weight | Equal-Weight |
| Nov 2, 2026 | Freedom Broker | main | Buy | Buy |
| Nov 2, 2026 | UBS | main | Neutral | Neutral |
| Nov 2, 2026 | Barclays | main | Equal-Weight | Equal-Weight |
| Oct 21, 2026 | UBS | main | Neutral | Neutral |
| Oct 19, 2026 | Scotiabank | up | Sector Perform | Sector Outperform |
About Vale S.A.
Vale S.A., together with its subsidiaries, produces iron ore and nickel in Brazil, Asia, the Middle East, North Africa, Europe, the Americas, and Oceania. The company operates in two segments, Iron Ore Solutions and Vale Base Metals. It extracts, produces, and distributes iron ore, iron ore pellets, briquettes, nickel, copper, other ferrous products, and by-products, including gold, silver, cobalt, platinum-group metals, and other base metals, as well as low-carbon critical minerals. The company also operates logistics systems and distribution centers, such as mining complexes, railways, and maritime terminals, ports, and ships; generates energy from hydroelectric, solar, and wind sources; and engages in greenfield mineral exploration. In addition, it is involved in research; and trading activities. The company was formerly known as Companhia Vale do Rio Doce and changed its name to Vale S.A. in May 2009. Vale S.A. was founded in 1942 and is headquartered in Rio De Janeiro, Brazil.
- Sector
- Basic Materials
- Industry
- Other Industrial Metals & Mining
- Country
- Brazil
- Website
- vale.com
News
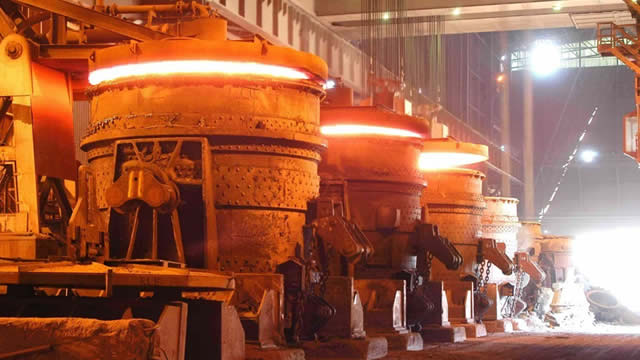 Here is What to Know Beyond Why VALE S.A. (VALE) is a Trending Stock
 Vale S.A. $VALE Shares Newly Purchased by ARGA Investment Management LP
 Wells Fargo Maintains Equal-Weight on Vale, Lowers Price Target to $13
 UBS Maintains Neutral on Vale, Lowers Price Target to $13.5
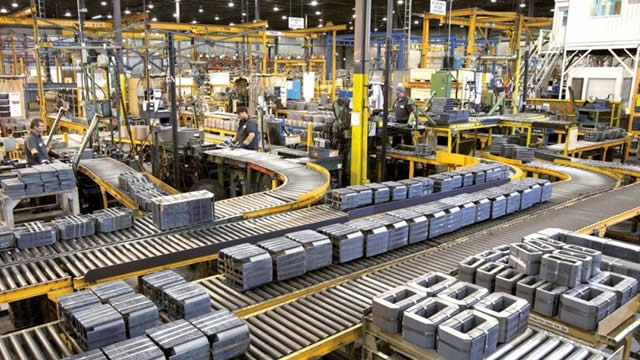 Vale Q3 Earnings Call Highlights
 Vale S.A. (VALE) Q3 2026 Earnings Call Transcript
 Vale Q3 2026 Earnings Call Transcript
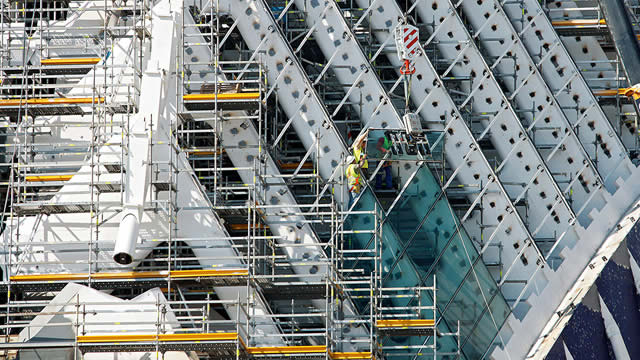 Vale: Buying Before The Cycle Turns Despite A Weak Q3
 Compared to Estimates, VALE (VALE) Q3 Earnings: A Look at Key Metrics
 Amazon, Eli Lilly On Deck Thursday As AWS Growth, Drug Demand Face Test
Your note
Sign in to keep a note on VALE — it syncs with the Stock Master app.
Institution ownership
| Holder | % held | Shares | Value | Reported |
|---|---|---|---|---|
| Capital World Investors | 2.96% | 131,508,037 | 1.50B | Jun 29, 2026 |
| Blackrock Inc. | 1.44% | 63,828,464 | 729.01M | Jun 29, 2026 |
| FMR, LLC | 1.25% | 55,345,652 | 632.12M | Jun 29, 2026 |
| Arrowstreet Capital, Limited Partnership | 0.72% | 31,949,655 | 364.91M | Jun 29, 2026 |
| Morgan Stanley | 0.63% | 27,894,968 | 318.60M | Jun 29, 2026 |
| Principal Financial Group, Inc. | 0.63% | 28,116,115 | 321.13M | Sep 29, 2026 |
Fund ownership
| Holder | % held | Shares | Value | Reported |
|---|---|---|---|---|
| AMERICAN FUNDS INSURANCE SERIES-Eupac Fund | 1.05% | 46,576,432 | 531.97M | Sep 29, 2026 |
| Income Fund of America | 0.53% | 23,342,691 | 266.61M | Sep 29, 2026 |
| Growth Fund of America | 0.49% | 21,824,908 | 249.27M | Sep 29, 2026 |
| Capital World Growth & Income Fund | 0.47% | 20,918,666 | 238.92M | Sep 29, 2026 |
| iShares Trust-iShares Latin America 40 ETF | 0.46% | 20,384,334 | 232.82M | Sep 29, 2026 |
| New World Fund Inc | 0.40% | 17,871,893 | 204.12M | Sep 29, 2026 |