

Vector Acquisition Corporation VACQ
11.57 0.00 (+0.00%)
At closeAug 25, 2021, 12:00 AM EDT
11.11 Day range 11.88
9.72 52-week range 15.15
- Market cap
- 437.72M
- Shares out
- 32.00M
- Volume
- 1.26M
- Avg volume
- 849.88K
- Open
- 11.30
- Previous close
- 11.57
- Day's range
- 11.11 – 11.88
- 52-week range
- 9.72 – 15.15
No chart data for this range yet.
Key statistics
- Enterprise value
- 462.76M
- PEG ratio
- 0.00
- Price / sales
- 0.00
- Price / book
- 0.00
- Dividend yield
- 0.00%
- Payout ratio
- 0.00%
- Revenue growth
- 0.00%
- Free cash flow
- 0
- Total cash
- 44.85K
- Total debt
- 0
- Return on equity
- 0.00%
- Short % of float
- 2.87%
- 50-day average
- 10.48
- 200-day average
- 10.78
Next earnings
Consensus EPS estimate 0.00.
About Vector Acquisition Corporation
Vector Acquisition Corporation does not have significant operations. It focuses on effecting a merger, share exchange, asset acquisition, share purchase, reorganization, or similar business combination with one or more businesses. The company was incorporated in 2020 and is based in San Francisco, California.
- Sector
- Financial Services
- Industry
- Shell Companies
- Country
- United States
- Website
- vectorcapital.com
News
 Rocket Lab Completes Merger with Vector Acquisition Corporation to Become Publicly Traded End-to-End Space Company
 Why Did 2 Space Stocks Blast Off Tuesday?
 Rocket Lab's Mars mission gets green light from NASA
 Rocket Lab Spacecraft Confirmed for Mars as NASA Greenlights ESCAPADE Small Satellite Interplanetary Mission
 Factories in Space? Yeah, That's a Thing Now
 Vector Acquisition Corporation Shareholders Approve Proposed Merger With Rocket Lab
 Vector Acquisition Corporation Shareholders Approve Proposed Merger With Rocket Lab
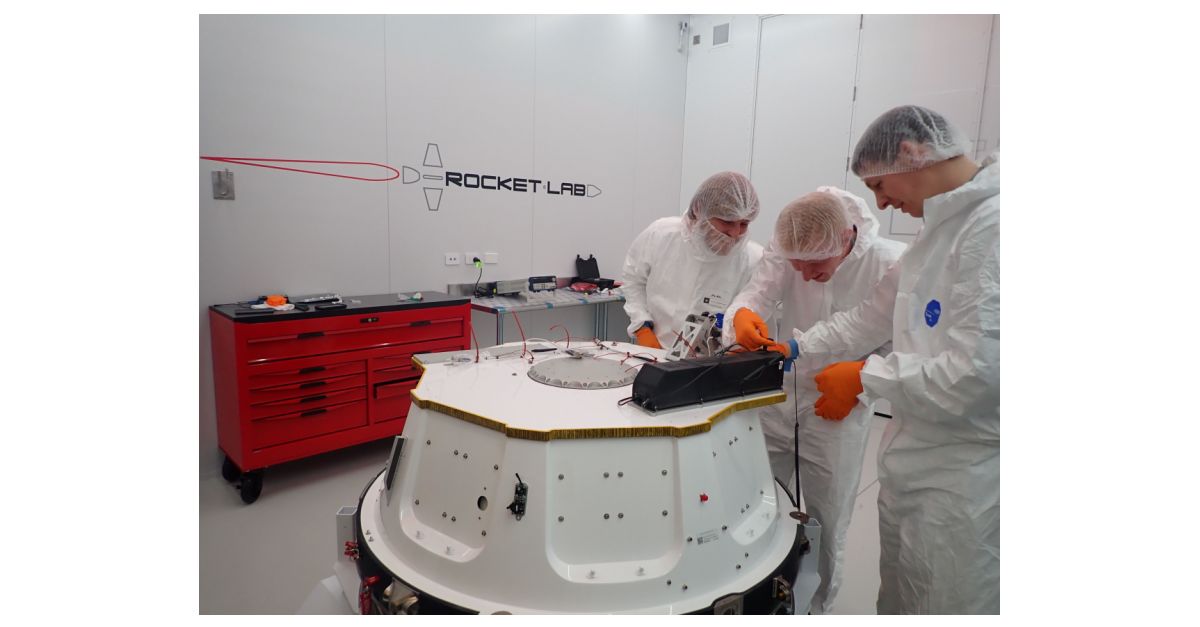 Rocket Lab to Launch Four PocketQube Satellites for Alba Orbital
 Rocket Lab to Launch Four PocketQube Satellites for Alba Orbital
 Aurora Propulsion Technologies will be sending up space junk removal tech on Rocket Lab's Electron later this year
Your note
Sign in to keep a note on VACQ — it syncs with the Stock Master app.
Institution ownership
| Holder | % held | Shares | Value | Reported |
|---|---|---|---|---|
| Think Investments LP | 5.11% | 1,635,000 | 17.81M | Jun 29, 2021 |
| Citadel Advisors LLC | 2.71% | 868,167 | 9.45M | Jun 29, 2021 |
| Millennium Management LLC | 2.66% | 849,977 | 9.26M | Jun 29, 2021 |
| UBS O'Connor LLC | 2.31% | 738,114 | 8.04M | Jun 29, 2021 |
| Omni Partners US LLC | 1.49% | 477,082 | 5.20M | Jun 29, 2021 |
| Washington Harbour Partners, LP | 1.40% | 446,663 | 4.86M | Jun 29, 2021 |
Fund ownership
| Holder | % held | Shares | Value | Reported |
|---|---|---|---|---|
| Fidelity NASDAQ Composite Index Fund | 0.07% | 21,601 | 235.23K | Jun 29, 2021 |
| ETF Series Solutions-Defiance Next Gen SPAC Derived ETF | 0.03% | 8,627 | 93.95K | Jun 29, 2021 |