

Under Armour, Inc. UA
At closeNov 6, 2026, 7:14 PM EST
After hours · Nov 6, 7:14 PM ET
- YTD
- +6.04%
- 1 year
- +17.28%
- Market cap
- 2.19B
- Revenue (ttm)
- 4.93B
- Profit margin
- -9.99%
- EPS (ttm)
- -1.15
- Shares out
- 206.26M
- Forward P/E
- 13.41
- YTD return
- +6.04%
- 1-year return
- +17.28%
- Volume
- 5.02M
- Avg volume
- 2.57M
- Open
- 5.00
- Previous close
- 5.36
- Day's range
- 4.96 – 5.45
- 52-week range
- 3.96 – 7.88
- Beta
- 1.60
- Earnings date
- Feb 4, 2027
ALL -35.42 (-87.44%)
Key statistics
- Enterprise value
- 3.28B
- PEG ratio
- 1.36
- Price / sales
- 0.44
- Price / book
- 1.53
- Dividend yield
- 0.00%
- Payout ratio
- 0.00%
- Revenue growth
- -3.20%
- Free cash flow
- 102.22M
- Total cash
- 395.98M
- Total debt
- 1.38B
- Return on equity
- -29.83%
- Short % of float
- 0.00%
- 50-day average
- 4.76
- 200-day average
- 5.77
Next earnings
Feb 4, 2027
Expected Feb 4, 2027. Consensus EPS estimate 0.00.
Earnings
| Report date | Quarter ending | EPS estimate | EPS reported | Surprise | Surprise % |
|---|---|---|---|---|---|
| Feb 4, 2027 | Dec 30, 2026 | 0.04358 | — | — | — |
| Nov 6, 2026 | Sep 30, 2026 | -0.00743 | -0.001 | +0.01 | +86.54% |
| Aug 7, 2026 | Jun 30, 2026 | 0.01701 | 0.05 | +0.03 | +193.94% |
| May 12, 2026 | Mar 31, 2026 | -0.01948 | -0.03 | -0.01 | -54.00% |
| Feb 6, 2026 | Dec 31, 2025 | -0.01548 | 0.09 | +0.11 | +681.40% |
| Nov 6, 2025 | Sep 30, 2025 | 0.02446 | 0.04 | +0.02 | +63.53% |
Upgrades / downgrades
| Date | Firm | Action | From | To |
|---|---|---|---|---|
| Jun 24, 2024 | Stifel | main | Buy | Buy |
| Oct 26, 2022 | Citigroup | main | — | Neutral |
| Feb 2, 2022 | Morgan Stanley | up | Equal-Weight | Overweight |
| Feb 12, 2020 | Credit Suisse | main | — | Neutral |
| May 17, 2019 | JP Morgan | up | Neutral | Overweight |
| Feb 14, 2018 | JP Morgan | main | Neutral | Neutral |
About Under Armour, Inc.
Under Armour, Inc., together with its subsidiaries, engages in designing, developing, marketing, and distributing performance apparel, footwear, and accessories for men, women, and youth. The company provides its apparel in compression, fitted, and loose fit types. It also offers footwear products for running, training, basketball, cleated sports, recovery, and outdoor applications, as well as for casual use. In addition, the company provides accessories, which include gloves, bags, headwear, and socks. It primarily offers its products under the UNDER ARMOUR, ARMOUR, HEATGEAR, COLDGEAR, HOVR, UA, PROTECT THIS HOUSE, I WILL, ARMOUR FLEECE, and ARMOUR BRA brands. The company sells its products through wholesale channels, including national and regional sporting goods chains, independent and specialty retailers, department store chains, mono-branded Under Armour retail stores, institutional athletic departments, and leagues and teams, as well as independent distributors; and directly to consumers through its own brand and factory house retail stores and e-commerce websites. It operates in the United States, Canada, Europe, the Middle East, Africa, the Asia-Pacific, and Latin America. The company was incorporated in 1996 and is headquartered in Baltimore, Maryland.
- Sector
- Consumer Cyclical
- Industry
- Apparel Manufacturing
- Country
- United States
- Website
- underarmour.com
News
 Under Armour Q2 2027 Earnings Call Transcript
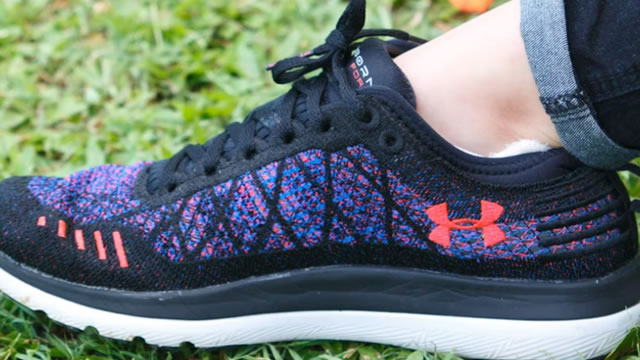 Under Armour warns of bigger Middle East hit, cuts annual gross margin growth target
 Under Armour Q2 Sales $1.242B Beat $1.225B Estimate
 Under Armour Raises FY2027 GAAP EPS Guidance from $(0.05)-$(0.01) to $(0.02)-$0.02 vs $0.09 Est
 Under Armour Raises FY2027 GAAP EPS Guidance from $(0.05)-$(0.01) to $(0.02)-$0.02 vs $0.02 Est
 Nike Stock Hits New Low as On Holding Competition Heats Up, Yields Spike, and S&P 500 Removal Nears
 Under Armour Files Prospectus For Potential Offerings of Debt, Equity And Warrants; No Terms Disclosed
 10 Consumer Discretionary Stocks Whale Activity In Today’s Session
 S&P 500 Falls From Record High Following Inflation Report: Investor Sentiment Improves, Fear Index Remains In 'Greed' Zone
 Dow Edges Higher; Under Armour Shares Tumble After Q4 Earnings
Your note
Sign in to keep a note on UA — it syncs with the Stock Master app.
Insider holders
| Insider | Relation | Latest transaction | Date | Shares held |
|---|---|---|---|---|
| BERGMAN DAVID E. | Chief Financial Officer | Stock Award(Grant) | May 4, 2025 | 574,721 |
| COLTHARP DOUGLAS EDWARD | Director | Stock Award(Grant) | Sep 30, 2026 | 460,289 |
| CURRAN SHAWN | Officer | Stock Award(Grant) | May 13, 2026 | 555,838 |
| EL-ERIAN MOHAMED A. | Director | Stock Award(Grant) | Aug 25, 2026 | 264,260 |
| LIEDTKE ERIC | Officer | Stock Award(Grant) | May 14, 2025 | 340,808 |
| PEAKE ADAM | Officer | Stock Award(Grant) | May 13, 2026 | 308,260 |
Institution ownership
| Holder | % held | Shares | Value | Reported |
|---|---|---|---|---|
| BDT Capital Partners, LLC | 32.29% | 66,605,319 | 339.52M | Jun 29, 2026 |
| Blackrock Inc. | 10.82% | 22,320,434 | 113.78M | Jun 29, 2026 |
| Fairfax Financial Holdings Ltd | 10.67% | 21,999,128 | 112.14M | Jun 29, 2026 |
| Dimensional Fund Advisors LP | 5.47% | 11,291,149 | 57.56M | Sep 29, 2026 |
| Vanguard Portfolio Management LLC | 3.79% | 7,823,875 | 39.88M | Jun 29, 2026 |
| Vanguard Capital Management LLC | 3.79% | 7,812,026 | 39.82M | Jun 29, 2026 |
Fund ownership
| Holder | % held | Shares | Value | Reported |
|---|---|---|---|---|
| iShares Trust-iShares Core S&P Small-Cap ETF | 3.45% | 7,118,518 | 36.29M | Sep 29, 2026 |
| VANGUARD INDEX FUNDS-Vanguard Total Stock Market Index Fund | 2.45% | 5,062,331 | 25.81M | Jun 29, 2026 |
| iShares Trust-iShares Russell 2000 ETF | 2.19% | 4,517,739 | 23.03M | Sep 29, 2026 |
| DFA INVESTMENT DIMENSIONS GROUP INC-U.S. Small Cap Value Portfolio | 1.39% | 2,864,839 | 14.60M | Jul 30, 2026 |
| VANGUARD INDEX FUNDS-Vanguard Small-Cap Index Fund | 1.27% | 2,610,601 | 13.31M | Jun 29, 2026 |
| VANGUARD INDEX FUNDS-Vanguard Extended Market Index Fund | 1.12% | 2,312,918 | 11.79M | Jun 29, 2026 |