

Satsuma Pharmaceuticals, Inc. STSA
At closeJun 7, 2023, 4:00 PM EDT
52-week range unavailable
- Market cap
- 36.47M
- Shares out
- 33.15M
- Forward P/E
- -1.29
- Volume
- 1.83M
- Open
- 1.11
- Previous close
- 1.10
- Day's range
- 1.10 – 1.10
- Beta
- 0.10
- Analysts
- Hold
- Price target
- 2.00 (+81.8%)
- Earnings date
- May 11, 2023
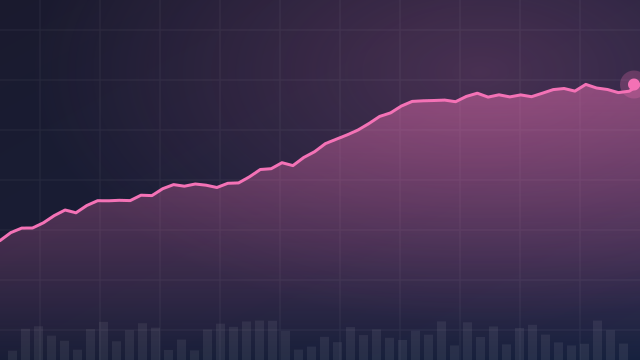
2Y -4.93 (-81.76%)
Key statistics
- Enterprise value
- -4.79M
- PEG ratio
- 0.00
- Price / sales
- 0.00
- Price / book
- 0.97
- Dividend yield
- 0.00%
- Payout ratio
- 0.00%
- Revenue growth
- 0.00%
- Free cash flow
- -24.91M
- Total cash
- 41.37M
- Total debt
- 116.00K
- Return on equity
- -104.04%
- Short % of float
- 0.74%
- 50-day average
- 0.991336
- 200-day average
- 2.18
Analyst view
Consensus: hold
- Target (low)
- 1.00
- Target (mean)
- 2.00
- Target (high)
- 3.00
- Strong buy1
- Buy0
- Hold4
- Sell0
- Strong sell0
Next earnings
May 11, 2023
Expected May 11, 2023. Consensus EPS estimate -0.27.
Financials — quick view
Earnings
| Report date | Quarter ending | EPS estimate | EPS reported | Surprise | Surprise % |
|---|---|---|---|---|---|
| May 11, 2023 | Mar 1, 2023 | -0.26 | — | — | — |
| Mar 28, 2023 | Dec 1, 2022 | -0.38 | — | — | — |
| Nov 3, 2022 | Sep 1, 2022 | -0.57 | — | — | — |
| Aug 9, 2022 | Jun 1, 2022 | -0.48 | — | — | — |
| May 10, 2022 | Mar 1, 2022 | -0.48 | — | — | — |
| Mar 15, 2022 | Dec 1, 2021 | -0.47 | — | — | — |
Upgrades / downgrades
| Date | Firm | Action | From | To |
|---|---|---|---|---|
| Apr 18, 2023 | HC Wainwright & Co. | down | Buy | Neutral |
| Mar 30, 2023 | Mizuho | reit | — | Neutral |
| Mar 30, 2023 | HC Wainwright & Co. | reit | — | Buy |
| Nov 15, 2022 | Mizuho | down | Buy | Neutral |
| Nov 15, 2022 | HC Wainwright & Co. | main | — | Buy |
| Nov 15, 2022 | SVB Leerink | down | Outperform | Market Perform |
About Satsuma Pharmaceuticals, Inc.
Satsuma Pharmaceuticals, Inc., a development-stage biopharmaceutical company, develops novel therapeutic products for the acute treatment of migraines. The company's product candidature includes STS101, a drug-device combination of a proprietary dry-powder formulation of dihydroergotamine mesylate, which can be self-administered with proprietary pre-filled, single-use, and nasal delivery device. Satsuma Pharmaceuticals, Inc. was incorporated in 2016 and is headquartered in South San Francisco, California. As of June 8, 2023, Satsuma Pharmaceuticals, Inc. operates as a subsidiary of Shin Nippon Biomedical Laboratories, Ltd.
- Sector
- Healthcare
- Industry
- Biotechnology
- Country
- United States
- Website
- satsumarx.com
News
 Satsuma Pharmaceuticals Announces Presentation of Two Clinical Program Abstracts at the American Headache Society's 68th Annual Scientific Meeting
 Satsuma Pharmaceuticals and SNBL Announce Publication of Impression of Use and Satisfaction with STS101 (Dihydroergotamine Nasal Powder (Atzumi™)) in Headache
 Satsuma Pharmaceuticals and SNBL Announce Four Abstracts to be Presented at the American Headache Society's 67th Annual Scientific Meeting
 Satsuma Pharmaceuticals Announces U.S. FDA Approval for Atzumi™ (Dihydroergotamine) Nasal Powder for the Acute Treatment of Migraine
 Satsuma Pharmaceuticals and SNBL Receive FDA Acceptance of NDA Resubmission of STS101 for the Acute Treatment of Migraine With or Without Aura
 Satsuma Pharmaceuticals and SNBL Resubmits the New Drug Application for STS101 (Dihydroergotamine Nasal Powder) for the Acute Treatment of Migraine With or Without Aura
 Satsuma Pharmaceuticals and SNBL Announce Publication of STS101 (Dihydroergotamine Nasal Powder) Pivotal Phase 3 ASCEND Study in CNS Drugs
 Satsuma Pharmaceuticals and SNBL Announce Five Abstracts on STS101 for the Acute Treatment of Migraine to be Presented at the American Headache Society's 66th Annual Scientific Meeting
 Benzinga's Top Ratings Upgrades, Downgrades For April 18, 2023
 Gold Drops Below $2,000; Charles Schwab Earnings Top Views
Your note
Sign in to keep a note on STSA — it syncs with the Stock Master app.
Insider holders
| Insider | Relation | Latest transaction | Date | Shares held |
|---|---|---|---|---|
| ALBRECHT DETLEF | Officer | Sale | Aug 31, 2020 | 20,212 |
| COMMODORE CAPITAL LP | Beneficial Owner of more than 10% of a Class of Security | Sale | Nov 13, 2022 | 0 |
| HADLEY HARBOR MASTER INVESTORS CAYMAN II, L.P. | Beneficial Owner of more than 10% of a Class of Security | Conversion of Exercise of derivative security | Sep 16, 2019 | 1,105,150 |
| LEONARD BRADEN MICHAEL | Beneficial Owner of more than 10% of a Class of Security | Purchase | Nov 20, 2022 | 6,590,000 |
| O'NEIL THOMAS PAUL | Chief Financial Officer | Sale | Aug 31, 2020 | 0 |
| RA CAPITAL MANAGEMENT, L.P. | Beneficial Owner of more than 10% of a Class of Security | Purchase | Feb 25, 2021 | 0 |
Institution ownership
| Holder | % held | Shares | Value | Reported |
|---|---|---|---|---|
| Bml Capital Management, LLC | 19.43% | 6,440,000 | 7.08M | Mar 30, 2023 |
| RA Capital Management, L.P. | 17.84% | 5,914,252 | 6.51M | Mar 30, 2023 |
| NEA Management Company, LLC | 6.92% | 2,294,095 | 2.52M | Mar 30, 2023 |
| Vanguard Group, Inc. (The) | 2.78% | 920,517 | 1.01M | Mar 30, 2023 |
| Geode Capital Management, LLC | 1.25% | 414,344 | 455.78K | Mar 30, 2023 |
| Lion Point Capital, LP | 0.96% | 319,742 | 351.72K | Mar 30, 2023 |
Fund ownership
| Holder | % held | Shares | Value | Reported |
|---|---|---|---|---|
| Vanguard Total Stock Market Index Fund | 1.58% | 522,516 | 574.77K | Dec 30, 2022 |
| Vanguard Extended Market Index Fund | 1.02% | 337,139 | 370.85K | Dec 30, 2022 |
| Fidelity NASDAQ Composite Index ETF | 0.66% | 217,688 | 239.46K | Mar 30, 2023 |
| Fidelity Extended Market Index Fund | 0.31% | 102,799 | 113.08K | Feb 27, 2023 |
| DFA U.S. Small Cap Series | 0.27% | 88,161 | 96.98K | Jan 30, 2023 |
| Bridgeway Funds Inc-Ultra Small Company Market Fund | 0.20% | 65,000 | 71.50K | Dec 30, 2022 |