

China Petroleum & Chemical Corporation SNPMF
0.60 USD +0.04 (+7.14%)
At closeOct 30, 2026, 4:00 PM EDT
0.60 Day range 0.60
0.50 52-week range 0.72
- YTD
- +5.26%
- 1 year
- +15.38%
- Market cap
- 72.41B
- EPS (ttm)
- 0.04
- P/E ratio
- 15.00
- YTD return
- +5.26%
- 1-year return
- +15.38%
- Volume
- 30.00K
- Avg volume
- 16.15K
- Open
- 0.60
- Previous close
- 0.56
- Day's range
- 0.60 – 0.60
- 52-week range
- 0.50 – 0.72
- Earnings date
- Aug 24, 2026
2Y +0.0600 (+10.71%)
Next earnings
Aug 24, 2026
Expected Aug 24, 2026. Consensus EPS estimate 0.01177.
Earnings
| Report date | Quarter ending | EPS estimate | EPS reported | Surprise | Surprise % |
|---|---|---|---|---|---|
| Aug 24, 2026 | Jun 30, 2026 | 0.01177 | — | — | — |
| Apr 28, 2026 | Mar 31, 2026 | 0.01667 | 0.02044 | 0.00 | +22.62% |
| Mar 19, 2026 | Dec 31, 2025 | 0.00357 | -0.00071 | 0.00 | -119.89% |
| Oct 29, 2025 | Sep 30, 2025 | 0.01194 | 0.00969 | 0.00 | -18.84% |
| Aug 21, 2025 | Jun 30, 2025 | 0.01326 | 0.01256 | 0.00 | -5.28% |
| Apr 27, 2025 | Mar 31, 2025 | 0.0186 | 0.01502 | 0.00 | -19.25% |
News
 China oil demand to fall 8.9% in 2026, Sinopec research says
 New Sinopec boss presses reset for world's biggest oil refiner
 Chinese refiner Sinopec to boost oil imports from outside the Gulf
 Sinopec's half-year profit grew 19.3% on year despite Iran war, falling demand
 China's Sinopec establishes four business units in major overhaul, officials say
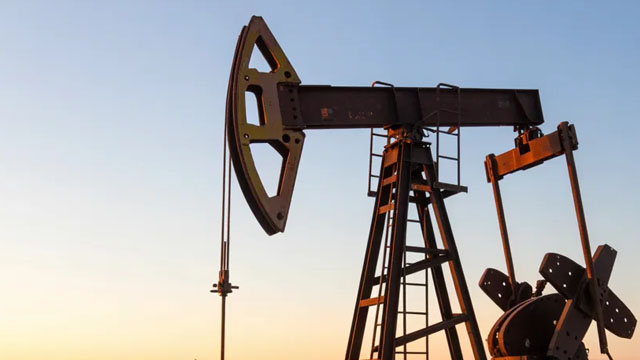 Sinopec deepens aviation fuel push with CNAF restructuring
 Allied Biofuels Signs FEED + Detailed Engineering Contract with Rollover to EPC with Sinopec Engineering Group for US$6.1 Billion SAF and e-SAF Project in Uzbekistan
 China's Sinopec books major reserves in ultra-deep shale gas find
 Sinopec's Ziyang Dongfeng Shale Gas Field Reports Proven Reserve of 235.687 Billion Cubic Meters
 Sinopec Launches "Fenghuo" Industrial AI Agent: An Industry First That Turns AI into Digital Employees And Domain Experts
Your note
Sign in to keep a note on SNPMF — it syncs with the Stock Master app.