

Siemens Energy AG SMERY
29.10 USD +0.05 (+0.17%)
At closeNov 13, 2026, 4:00 PM EST
28.79 Day range 29.10
23.13 52-week range 44.64
- YTD
- +3.82%
- 1 year
- +13.67%
- Market cap
- 123.80B
- EPS (ttm)
- 1.02
- P/E ratio
- 28.53
- YTD return
- +3.82%
- 1-year return
- +13.67%
- Volume
- 102.95K
- Avg volume
- 936.56K
- Open
- 28.99
- Previous close
- 29.05
- Day's range
- 28.79 – 29.10
- 52-week range
- 23.13 – 44.64
- Earnings date
- Nov 13, 2026
No chart data for this range yet.
Next earnings
Nov 13, 2026
Expected Nov 13, 2026. Consensus EPS estimate 0.3055.
Earnings
| Report date | Quarter ending | EPS estimate | EPS reported | Surprise | Surprise % |
|---|---|---|---|---|---|
| Nov 13, 2026 | Sep 30, 2026 | 0.3055 | — | — | — |
| Aug 5, 2026 | Jun 30, 2026 | 0.26 | 0.29 | +0.03 | +11.54% |
| May 12, 2026 | Mar 31, 2026 | 0.20 | 0.21 | +0.01 | +5.00% |
| Feb 11, 2026 | Dec 31, 2025 | 0.976 | 0.925 | -0.05 | -5.23% |
| Nov 13, 2025 | Sep 30, 2025 | 0.4753 | 0.22 | -0.26 | -53.71% |
| Aug 6, 2025 | Jun 30, 2025 | 0.503 | 0.79 | +0.29 | +57.06% |
News
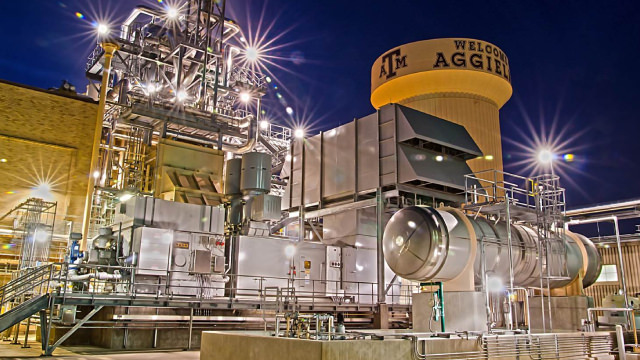 Siemens Energy: Entering The Supercycle
 Siemens Energy AG (SMERY) Q4 2026 Earnings Call Transcript
 Siemens Energy AG (SMERY) Q4 2026 Press Conference Call Transcript
 Midterm results won't derail U.S. data centers: Siemens Energy CEO
 Europe's STOXX 600 near record high as Siemens Energy, CoreWeave outlooks lift sentiment
 Siemens Energy Targets Steeper Profit Gains Through 2030
 Siemens Energy expects margin boost in 2027 as data centres fuel turbine, grid demand
 Siemens Energy expands buyback programme with up to €9 billion more
 Japan's industry ministry, Siemens Energy to partner on floating offshore wind project
 Transition Industries Signs Definitive EPC Agreement with Siemens Energy and Techint E&C for Pacifico Mexinol's 210 MW Electrolyzer Facility
Your note
Sign in to keep a note on SMERY — it syncs with the Stock Master app.