

Siemens Energy AG SMEGF
147.50 USD +10.10 (+7.35%)
Nov 11, 2026, 12:02 PM EST
140.05 Day range 147.50
115.91 52-week range 223.95
- YTD
- +5.35%
- 1 year
- +16.83%
- Market cap
- 125.50B
- EPS (ttm)
- 3.62
- P/E ratio
- 40.75
- YTD return
- +5.35%
- 1-year return
- +16.83%
- Volume
- 250
- Avg volume
- 10.71K
- Open
- 142.50
- Previous close
- 137.40
- Day's range
- 140.05 – 147.50
- 52-week range
- 115.91 – 223.95
5D -11.01 (-7.54%)
Earnings
| Report date | Quarter ending | EPS estimate | EPS reported | Surprise | Surprise % |
|---|---|---|---|---|---|
| Aug 5, 2026 | Jun 30, 2026 | 1.34 | 1.44 | +0.10 | +7.46% |
| May 12, 2026 | Mar 31, 2026 | 1.10 | 1.02 | -0.08 | -7.27% |
| Feb 11, 2026 | Dec 31, 2025 | 0.976 | 0.928 | -0.05 | -4.92% |
| Dec 24, 2025 | Sep 30, 2025 | 0.4806 | 0.3227 | -0.16 | -32.85% |
| Aug 6, 2025 | Jun 30, 2025 | 0.506 | 0.824 | +0.32 | +62.85% |
| May 8, 2025 | Mar 31, 2025 | 0.3777 | 0.55 | +0.17 | +45.62% |
News
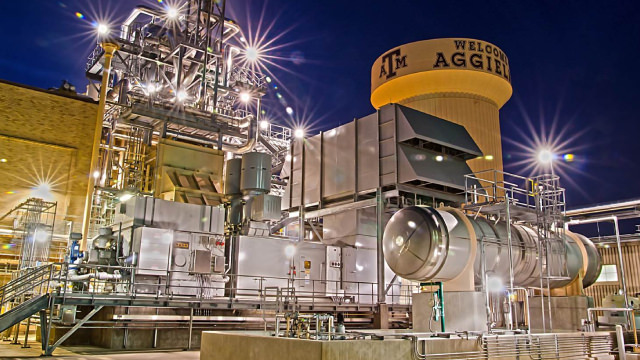 Siemens Energy: Entering The Supercycle
 Siemens Energy AG (SMERY) Q4 2026 Earnings Call Transcript
 Midterm results won't derail U.S. data centers: Siemens Energy CEO
 Siemens Energy Targets Steeper Profit Gains Through 2030
 Siemens Energy expects margin boost in 2027 as data centres fuel turbine, grid demand
 Siemens Energy expands buyback programme with up to €9 billion more
 Babcock & Wilcox Stock Surges 42% After Hours: Here's What Investors Need To Know
 GE Vernova Expands Wind Power Footprint With New German Project
Your note
Sign in to keep a note on SMEGF — it syncs with the Stock Master app.